Chart of the Month: June 2022
Making Sense of Contrary Indicators in the Developed Credit Market
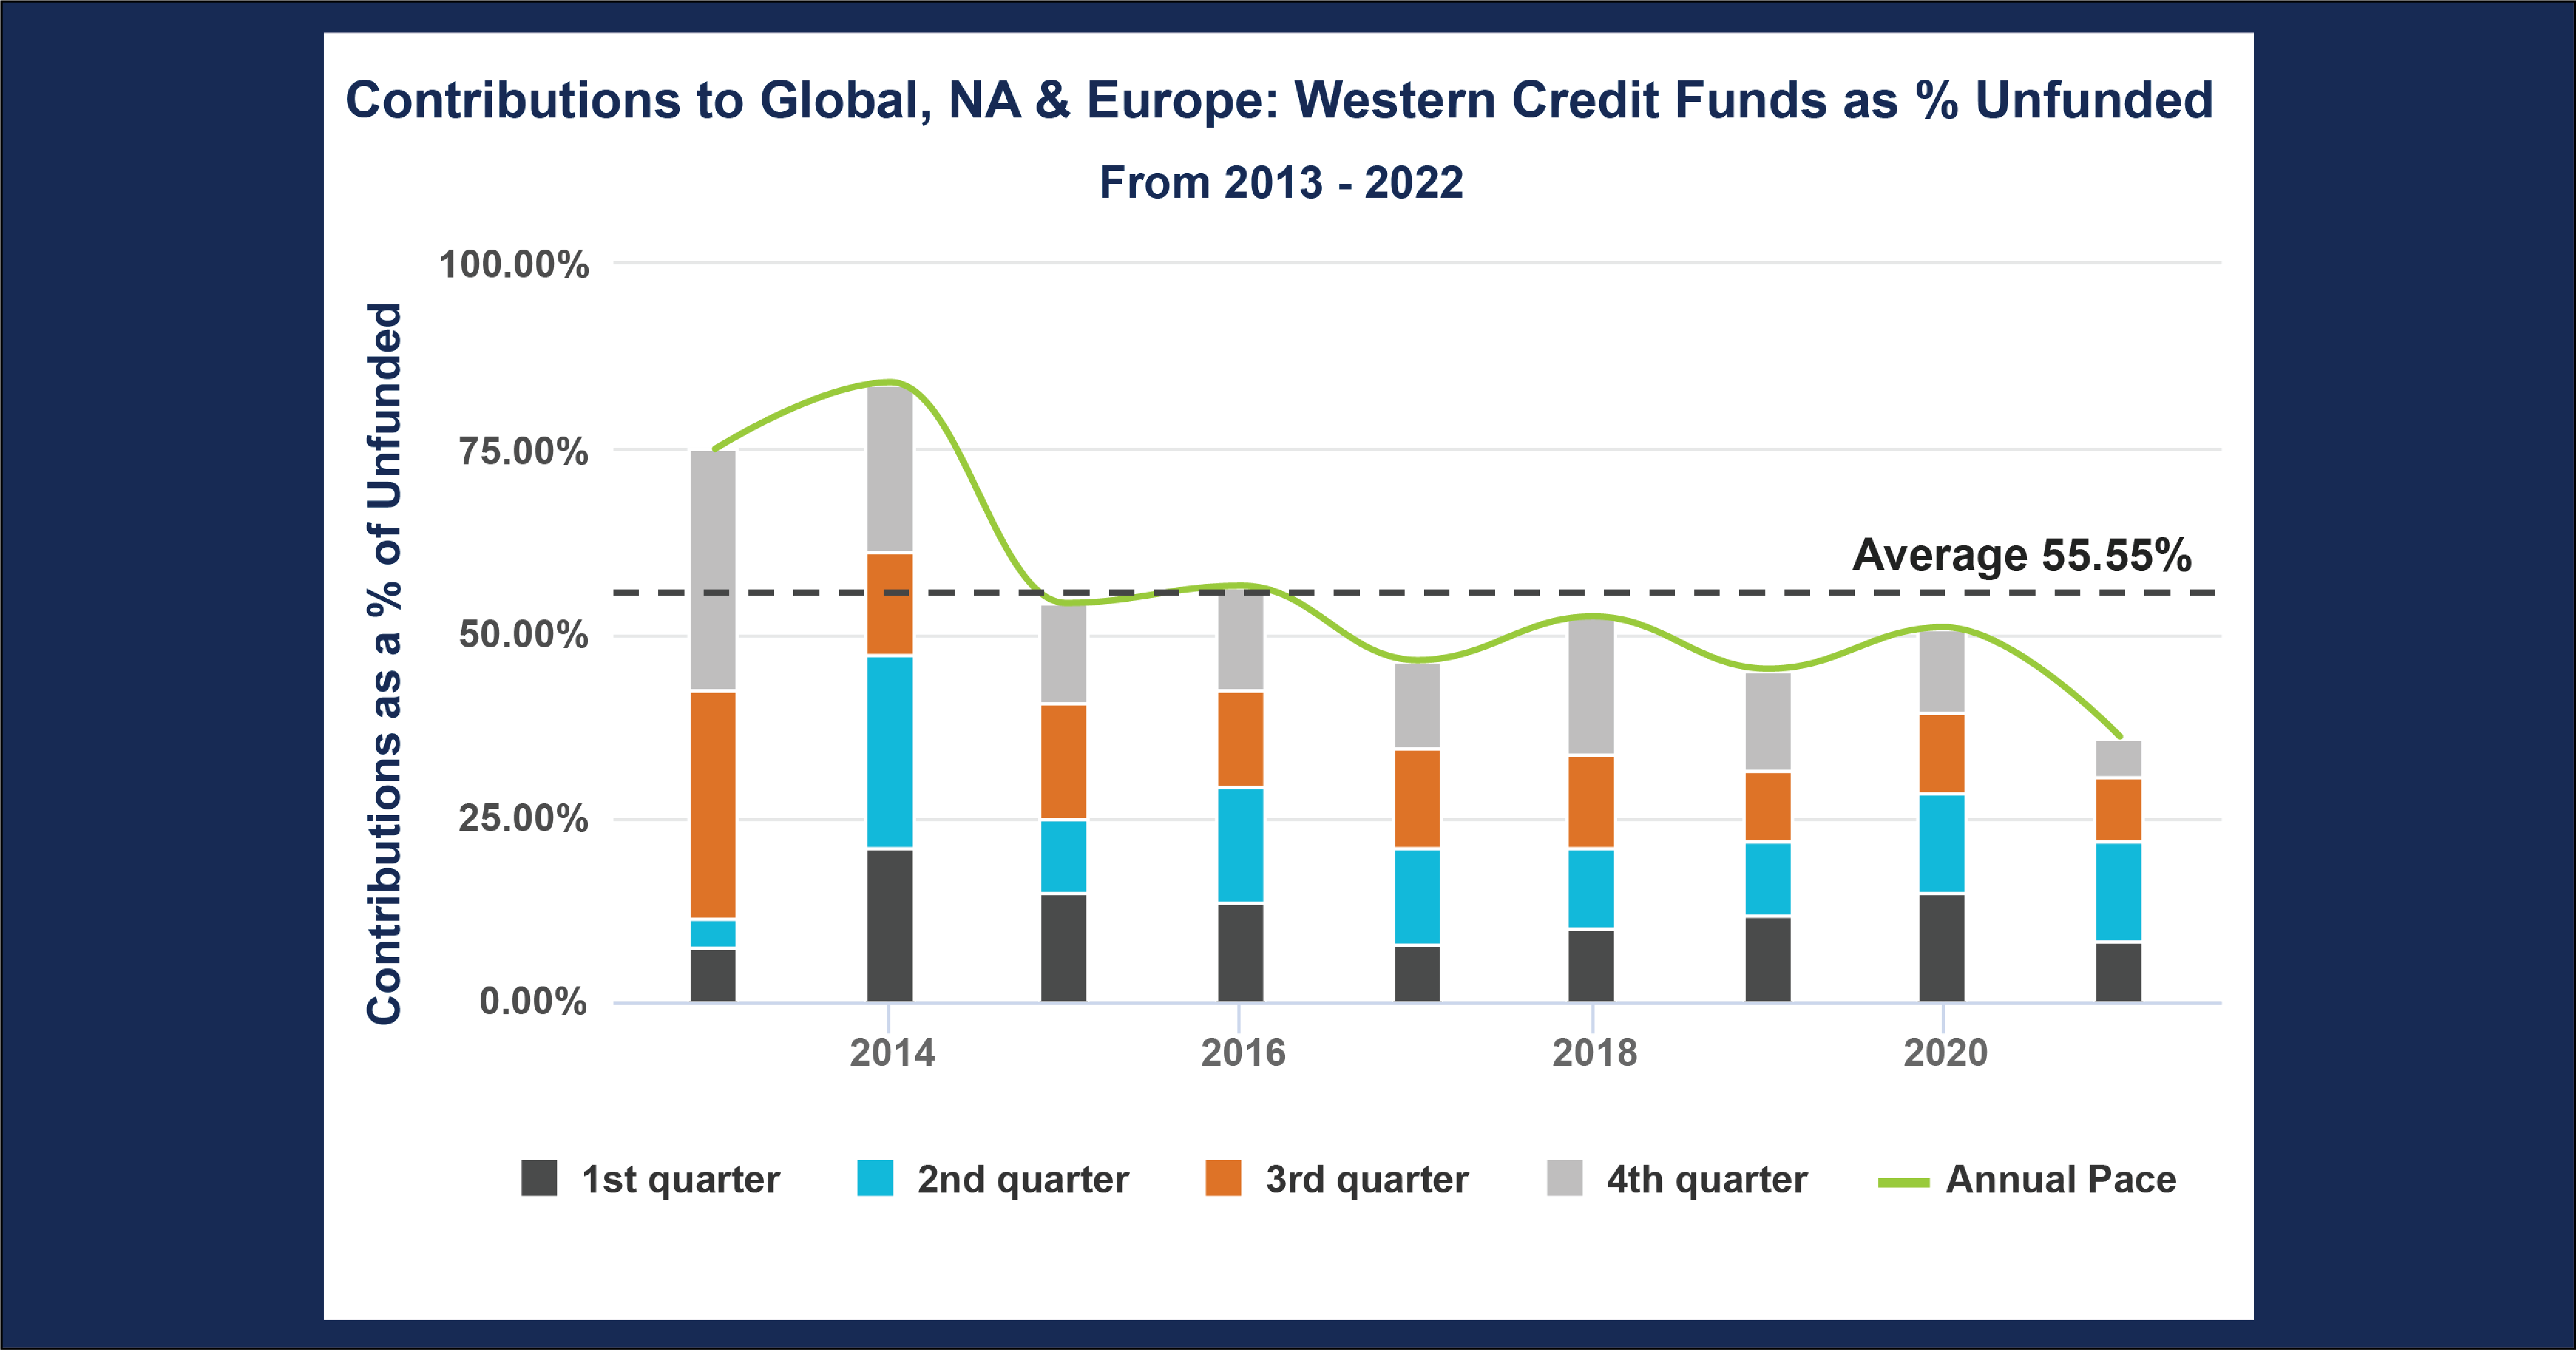
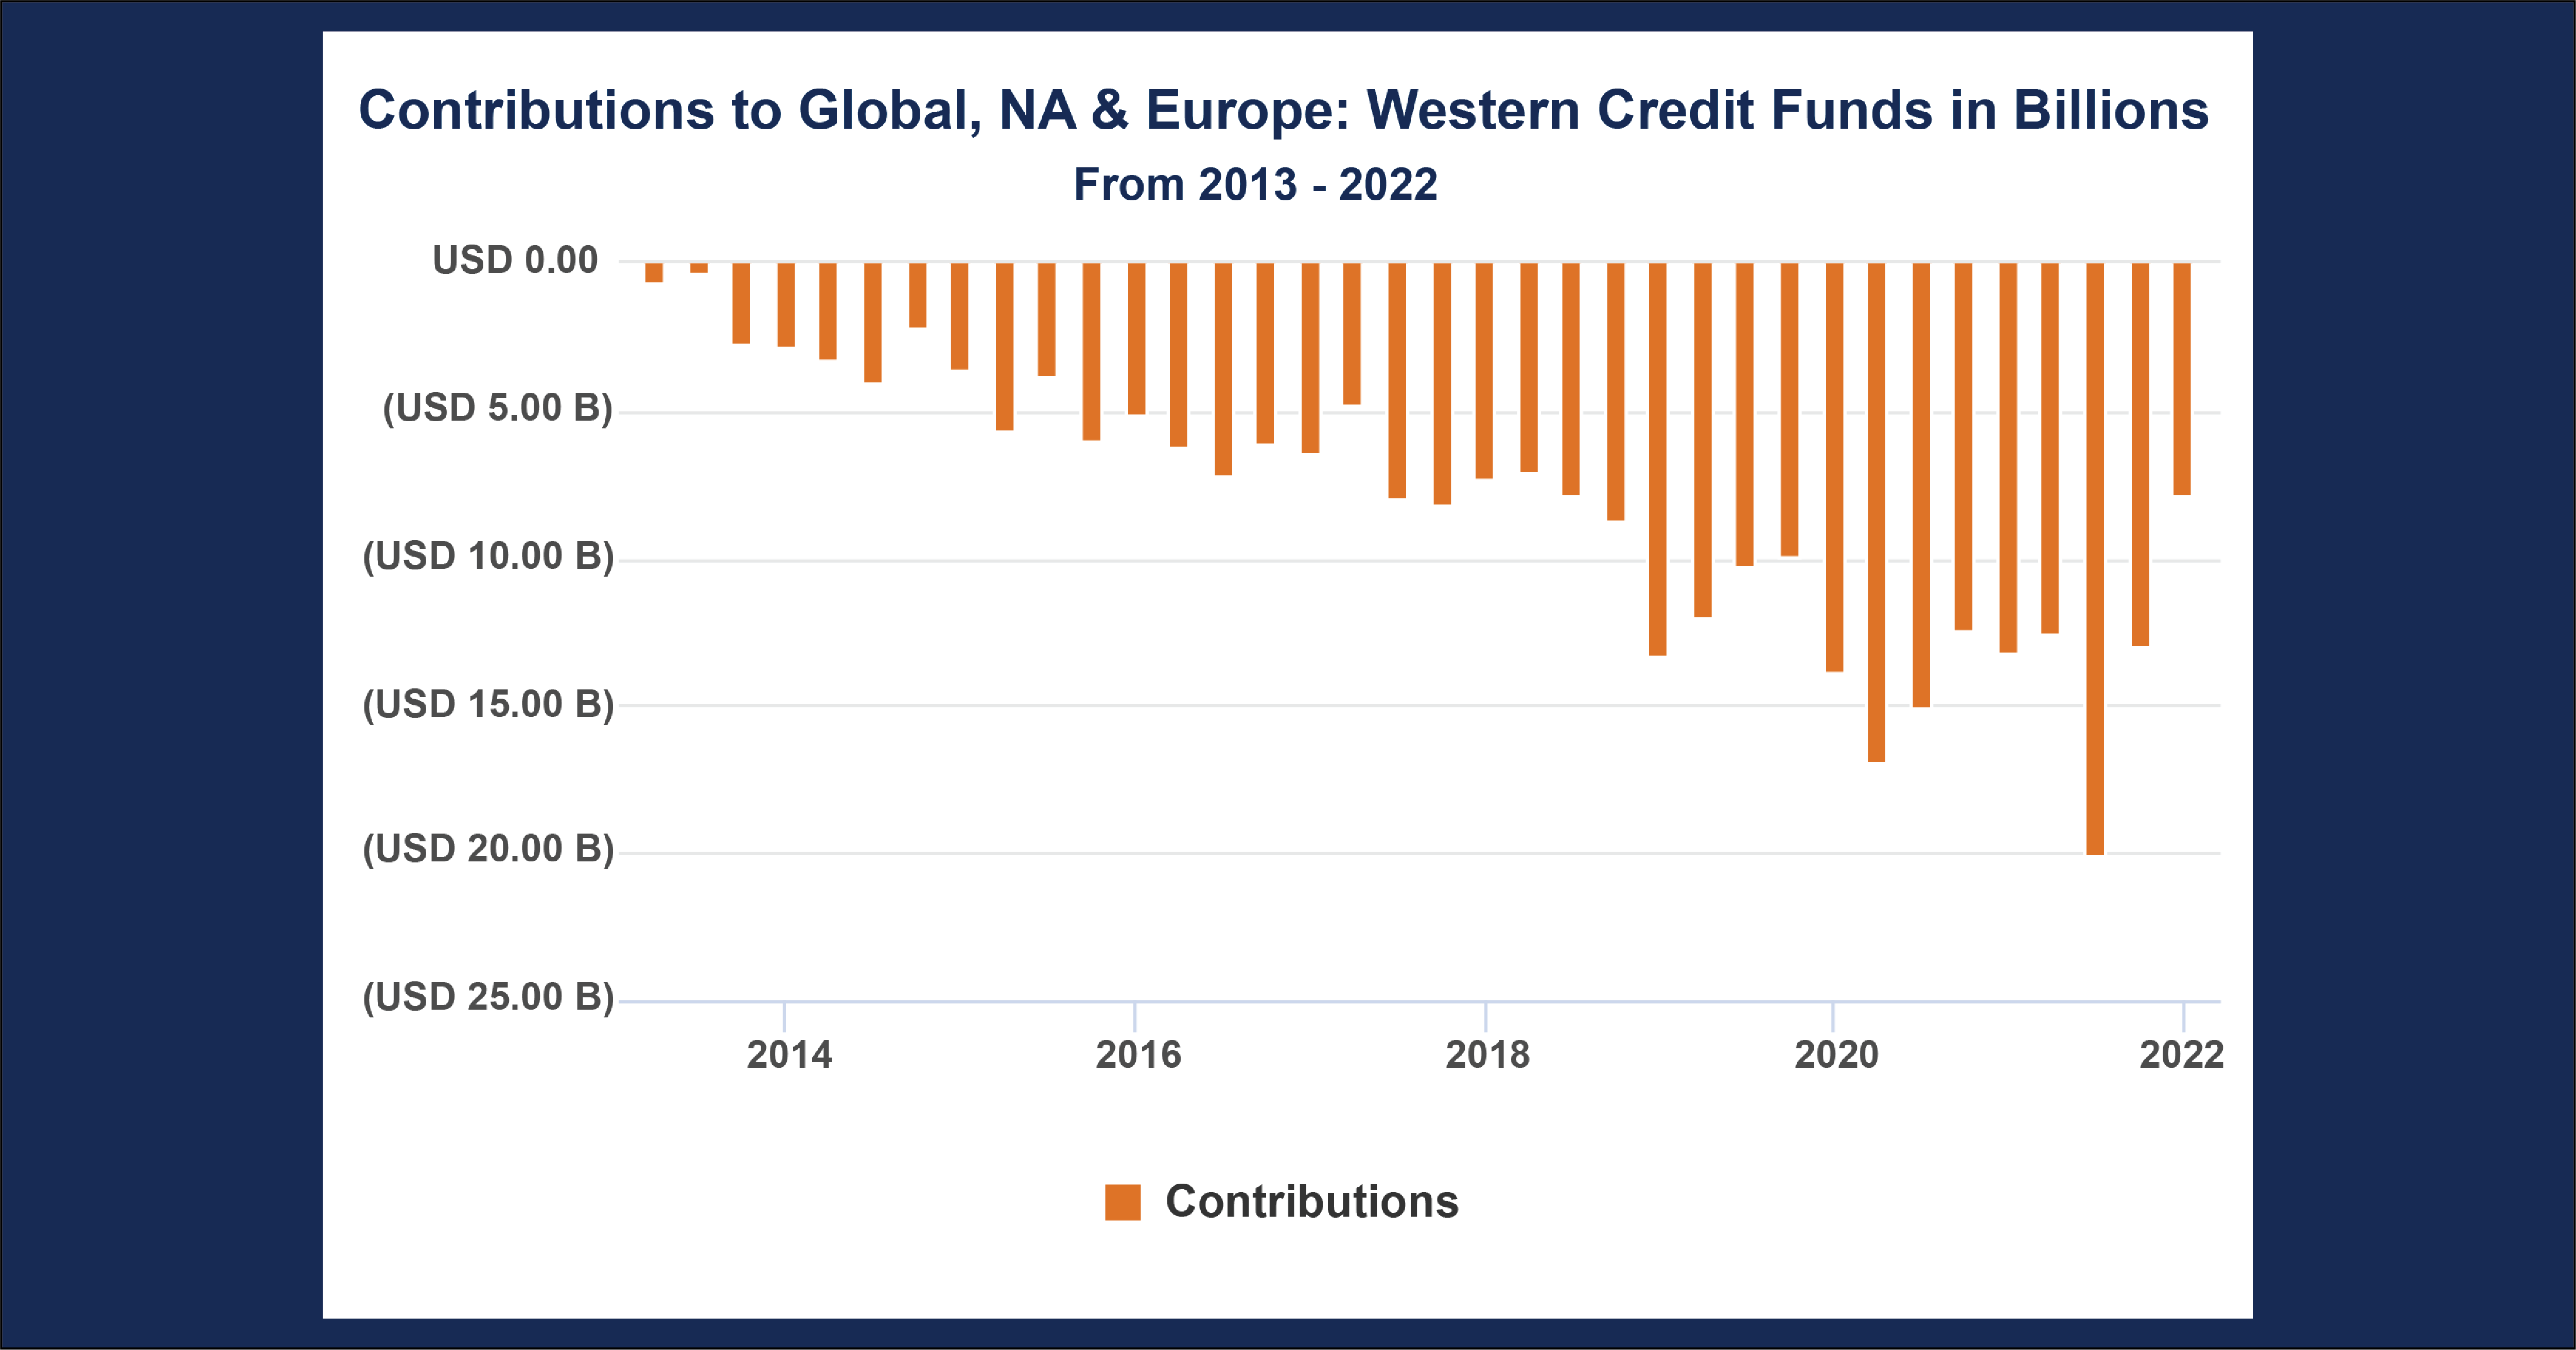
As predictions of contractions in private markets begin to rise, we thought it would be prescient to follow up our April chart and provide a counter examination of the extended credit market to elaborate on the demand trends in that sector over the past decade. To examine demand, we analyzed the market from two angles: by contribution rate and total contributions. This allows us to visualize the absolute demand, granular quarter-to-quarter shifts, and changes in demand independent of overall commitment size.
Chart #1

Chart #2

Key Takeaways:
- In the first chart above, we see notable trends in commitment rates. Between 2013-2014, the overall rate peaks above 75%. This is well above average and indicates that this was a particularly popular time to invest into distressed opportunities, likely taking advantage of the market rebound following the global financial crisis.
- Commitment rates trend down after 2014, reaching a low in 2021. In general, we anticipate long-term contribution rates to be around 40% of total commitment, so to see mean reversion is hardly surprising. The trend overshoots this goal and ends at around 35%, but this will likely be revised upwards to match the long-term average. The likely explanation for this is the lack of distressed opportunities in the 2010’s; once markets had completed their rebound, they continued to deliver into one of the most surprising bull markets in memory. As such, there was little opportunity for distressed investing until 2020, when opportunities were cut short by the remarkable rally.
- How does this fit in with the second chart? We see a strong trend over time of increased investment, which can be explained by macro factors: the early years have suppressed values since we have a smaller sample of vintages. In 2017, total investment begins to increase at a sharper rate. This is partially due to the rising tide effect, as money poured into private equity in all spaces. This also explains the drop in contribution rate. More money was flowing into credit funds out of a demand for alternatives, but there was no increased specific opportunity flow, thus letting the contribution rate return to its natural state.
Looking Ahead:
- As the drawdown of 2022 deepens and markets continue to contract, there may be a considerable number of credit opportunities emerging over the coming years. Because credit is uniquely suited to a distressed approach, it may not share the same patterns of drawdowns that other sectors of the private markets may experience over the next few years. Instead, it may pounce and see high demand (assuming valuations remain depressed).
- We can also anticipate a short-term fall in contribution rates while markets contract, a period which could last until 2023-2024 depending on the severity of the drawdown. However, demand will likely spike again once markets fully rebound as seen in 2013.
Subscribe to our blog:

Is There Geographic Bias in Macro Liquidity Trends in Private Markets?
Is There Geographic Bias in Macro Liquidity Trends in Private Markets? Building on our previous analysis of the role of…

Private Equity Performance: Large Strategies Versus Funds of Funds, Co-Investments, and Secondaries
Private Equity Performance: Large Strategies Versus Funds of Funds, Co-Investments, and Secondaries In private equity, the large strategies of buyouts,…

Examining Tariff Policy Impacts on Private Fund Contribution Rates
Examining Tariff Policy Impacts on Private Fund Contribution Rates Recently we examined the impact of Latin America presidential elections—which carry presumptions…