Chart of the Month: December 2023
The (Bar)Bell Curve: Looking at the Dispersion of PME Alpha by Private Market Funds
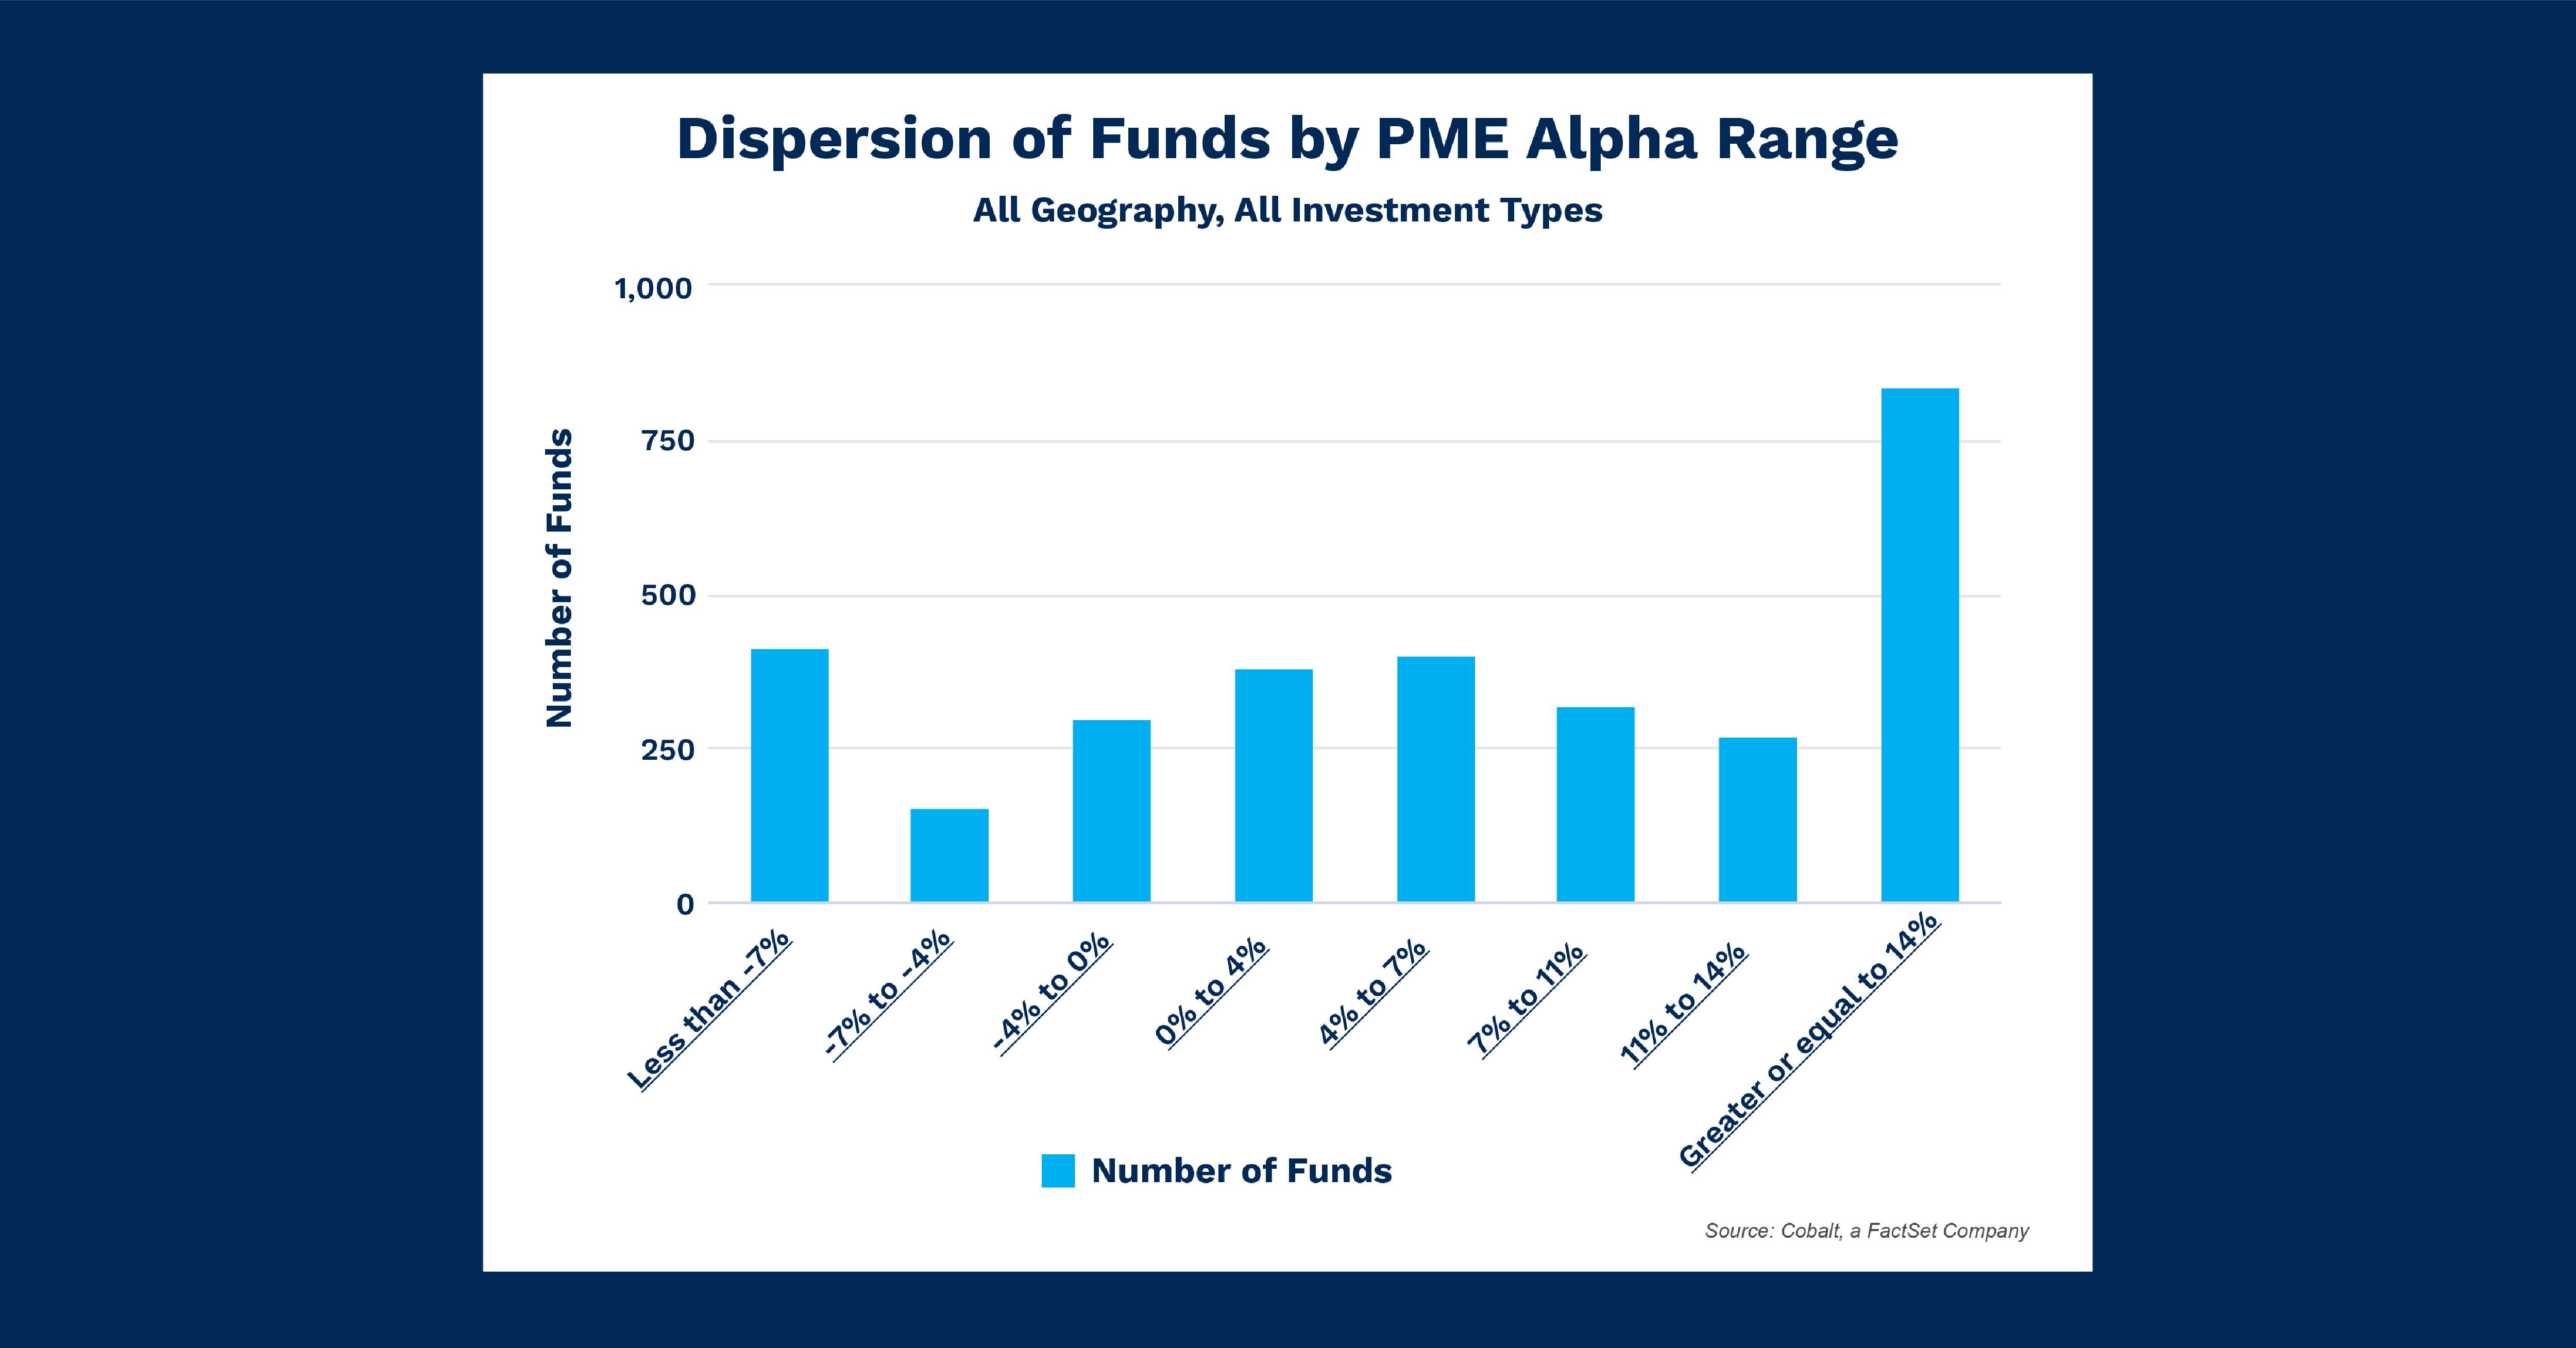
In past charts, we’ve discussed our PME (public market equivalent) engine and how it can be used to analyze a fund or group of private market funds against the public markets. The chart below encompasses our entire population of funds with cash flows and examines the most common outcomes of performance. Using the Cobalt PME methodology to compare our Market Data Funds against the MSCI ACWI, we generate a PME Alpha metric for funds with cash flows, and the dispersion of this alpha is reflected in the chart below.

Key Takeaways
Perhaps unsurprisingly, the largest group of funds are those with alpha over 14%, with over a quarter of funds reaching that threshold. A bit more surprising may be that second most common range is alpha less than -7%, with just over one-eighth of funds falling here. Between these two extremes we see a more typical distribution between -7% and 14% performance.
This creates a unique distribution where the most likely outcome is extreme over-or-under performance, with the next most likely result falling closer to 0%. The ranges reflecting slight overperformance and slight underperformance are the least common, signifying a market where private market investors are looking for big swings, and living with the big misses they may create.
Extending to include all funds with negative alpha, we see that 28% of funds have underperformed in comparison to the public markets. This likely skews towards newer funds, which often take a few quarters or years to start returning distributions and outperforming public equities. Still, this lines up with the idea that alternatives offer the chance to have outsize returns versus other markets, but the investments do come with more downside risk.
Looking Ahead
As this sample looks back on 20 years of data, it should be enough of a track record to give us a solid idea that the dispersion pattern moving forward will hold. There may be some slight variances, especially as funds raised in the volatile times of the pandemic begin to make their first distributions over the next few years but overall, we still expect the most common outcomes for funds to be higher outperformance or lower underperformance compared to the public markets.
For more information on PME and how Cobalt leverages it, download our white paper: Measuring Performance in Private Equity: The PME Cheat Sheet.
Subscribe to our blog:

Is There Geographic Bias in Macro Liquidity Trends in Private Markets?
Is There Geographic Bias in Macro Liquidity Trends in Private Markets? Building on our previous analysis of the role of…

Private Equity Performance: Large Strategies Versus Funds of Funds, Co-Investments, and Secondaries
Private Equity Performance: Large Strategies Versus Funds of Funds, Co-Investments, and Secondaries In private equity, the large strategies of buyouts,…

Examining Tariff Policy Impacts on Private Fund Contribution Rates
Examining Tariff Policy Impacts on Private Fund Contribution Rates Recently we examined the impact of Latin America presidential elections—which carry presumptions…