Chart of the Month: June 2024
Silicon Safari: Examining the Trajectory of Sub-Saharan Investment Trends
In May, the US hosted Kenya President William Ruto as part of a diplomatic effort with the Sub-Saharan Africa nation. Much of the focus was on the economic relationship and potential partnership for investing in areas such as technology startups in Kenya’s “Silicon Savannah” or sharing funding from the CHIPS Act.
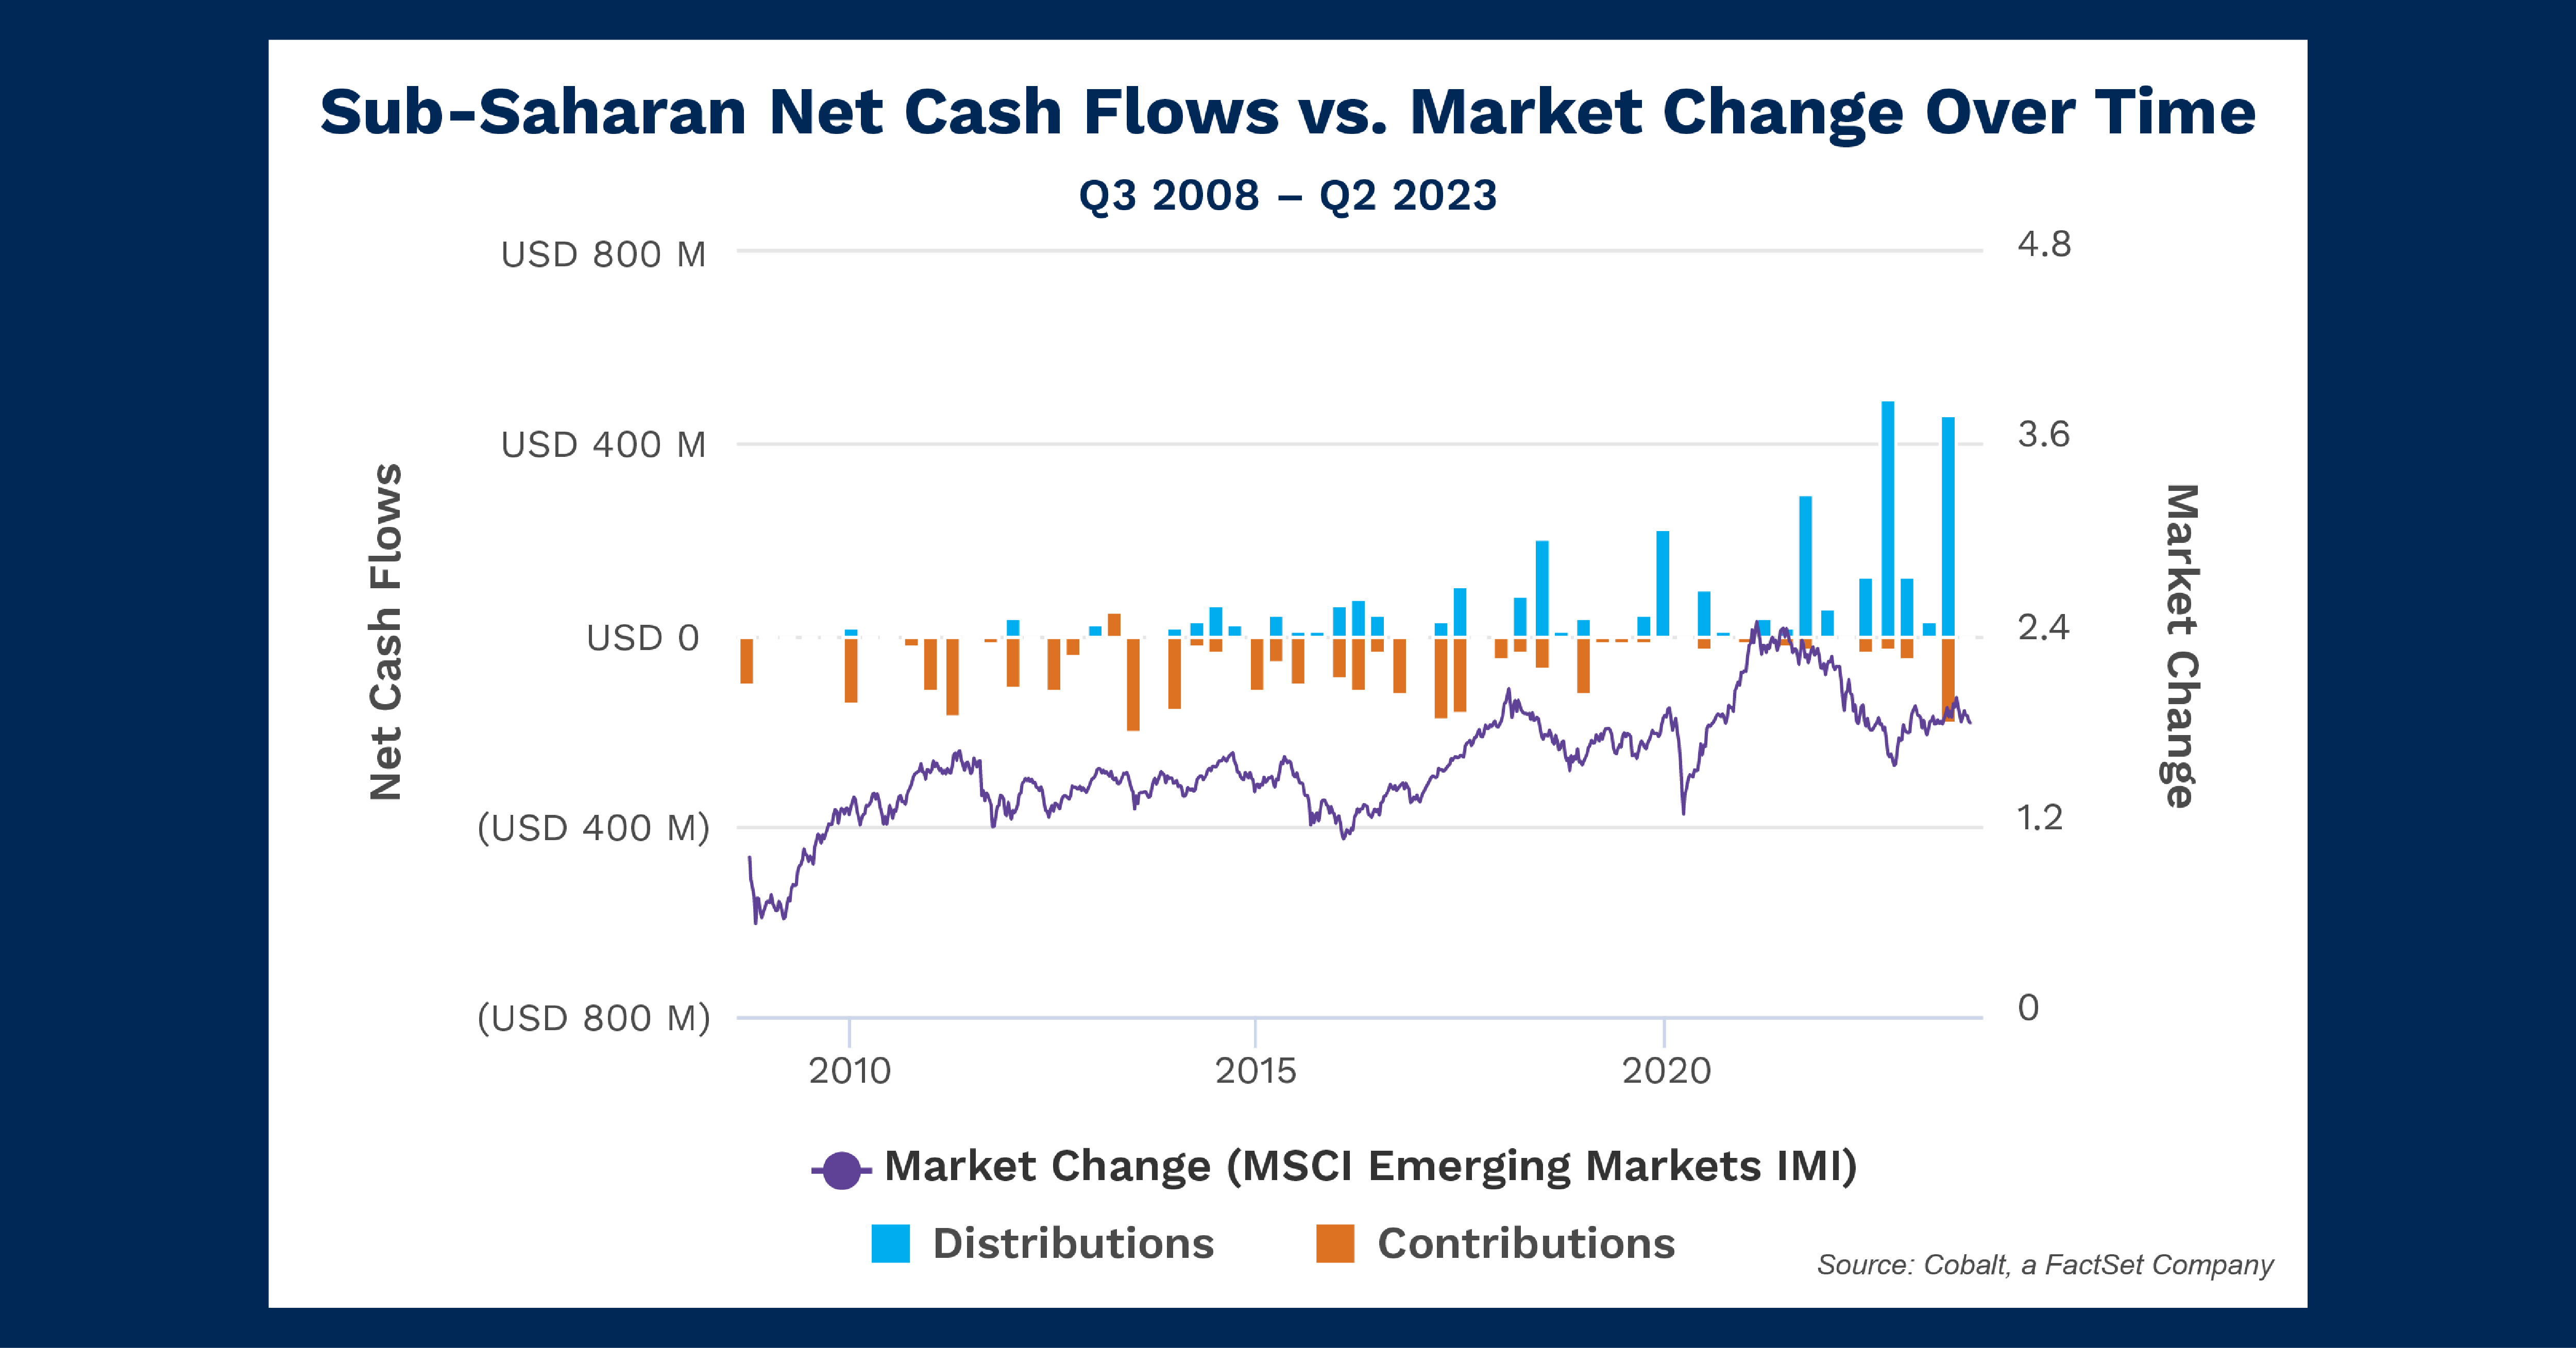
Building upon our previous analysis of emerging market investment, in this article we’re investigating investment interest and returns so far in the region. The chart below shows the levels of contributions and distributions over the past 15 years, overlaid with a comparable index (MSCI Emerging Markets IMI) to show regional performance in the public markets.

Key Takeaways
While the relatively small size of the sub-Saharan private market means there will be lower volumes of cash flows to measure, we see a pattern of fairly low but consistent contributions from 2010 to 2020. After 2020, the contributions largely drop off except for a return to form in 2023. This is a result of a small sample size, largely concentrated in funds raised in the early to mid-2010s. When these funds were fully contributed by 2020, the contributions dropped off, with newer funds beginning to show up in 2023. Overall, it indicates a stable but low level of interest in investment.
On the other hand, the distributions tell a different story. As expected, the distributions slowly begin about three years after contributions had initiated. However, they proceeded to slowly build over the time period observed, ending at several multiples of the highest contribution levels. This and the choppy-but-consistent slow growth of the emerging market sector shows there are returns to be had—even with the small sample—and there may be room for increased investment.
Looking Ahead
In light of this news of greater investment into the region, investors will likely pay more attention to the Kenyan tech sector. And that interest could certainly spread into Ghana and Nigeria in West Africa, which have shown strong growth in population and tech capacity.
What remains to be seen is whether the sparse-but tangible returns the private sector has seen over the past 15 years are indicative of future capacity—or whether expanding the sample size will show a market no more remarkable than any other.
Subscribe to our blog:

Is There Geographic Bias in Macro Liquidity Trends in Private Markets?
Is There Geographic Bias in Macro Liquidity Trends in Private Markets? Building on our previous analysis of the role of…

Private Equity Performance: Large Strategies Versus Funds of Funds, Co-Investments, and Secondaries
Private Equity Performance: Large Strategies Versus Funds of Funds, Co-Investments, and Secondaries In private equity, the large strategies of buyouts,…

Examining Tariff Policy Impacts on Private Fund Contribution Rates
Examining Tariff Policy Impacts on Private Fund Contribution Rates Recently we examined the impact of Latin America presidential elections—which carry presumptions…