Tracking Private Market Investments in Natural Resources Through the Evolving Regulatory Environment
Tracking Private Market Investments in Natural Resources Through the Evolving Regulatory Environment
Recent months have seen temperatures rise between Exxon and large institutional LPs, namely CalPERS. The conversations are centered around board member votes and, more broadly, shareholder rights. While these factors don’t directly impact our Cobalt dataset, it’s a timely opportunity to analyze our LP base portfolio allocations to Natural Resource.
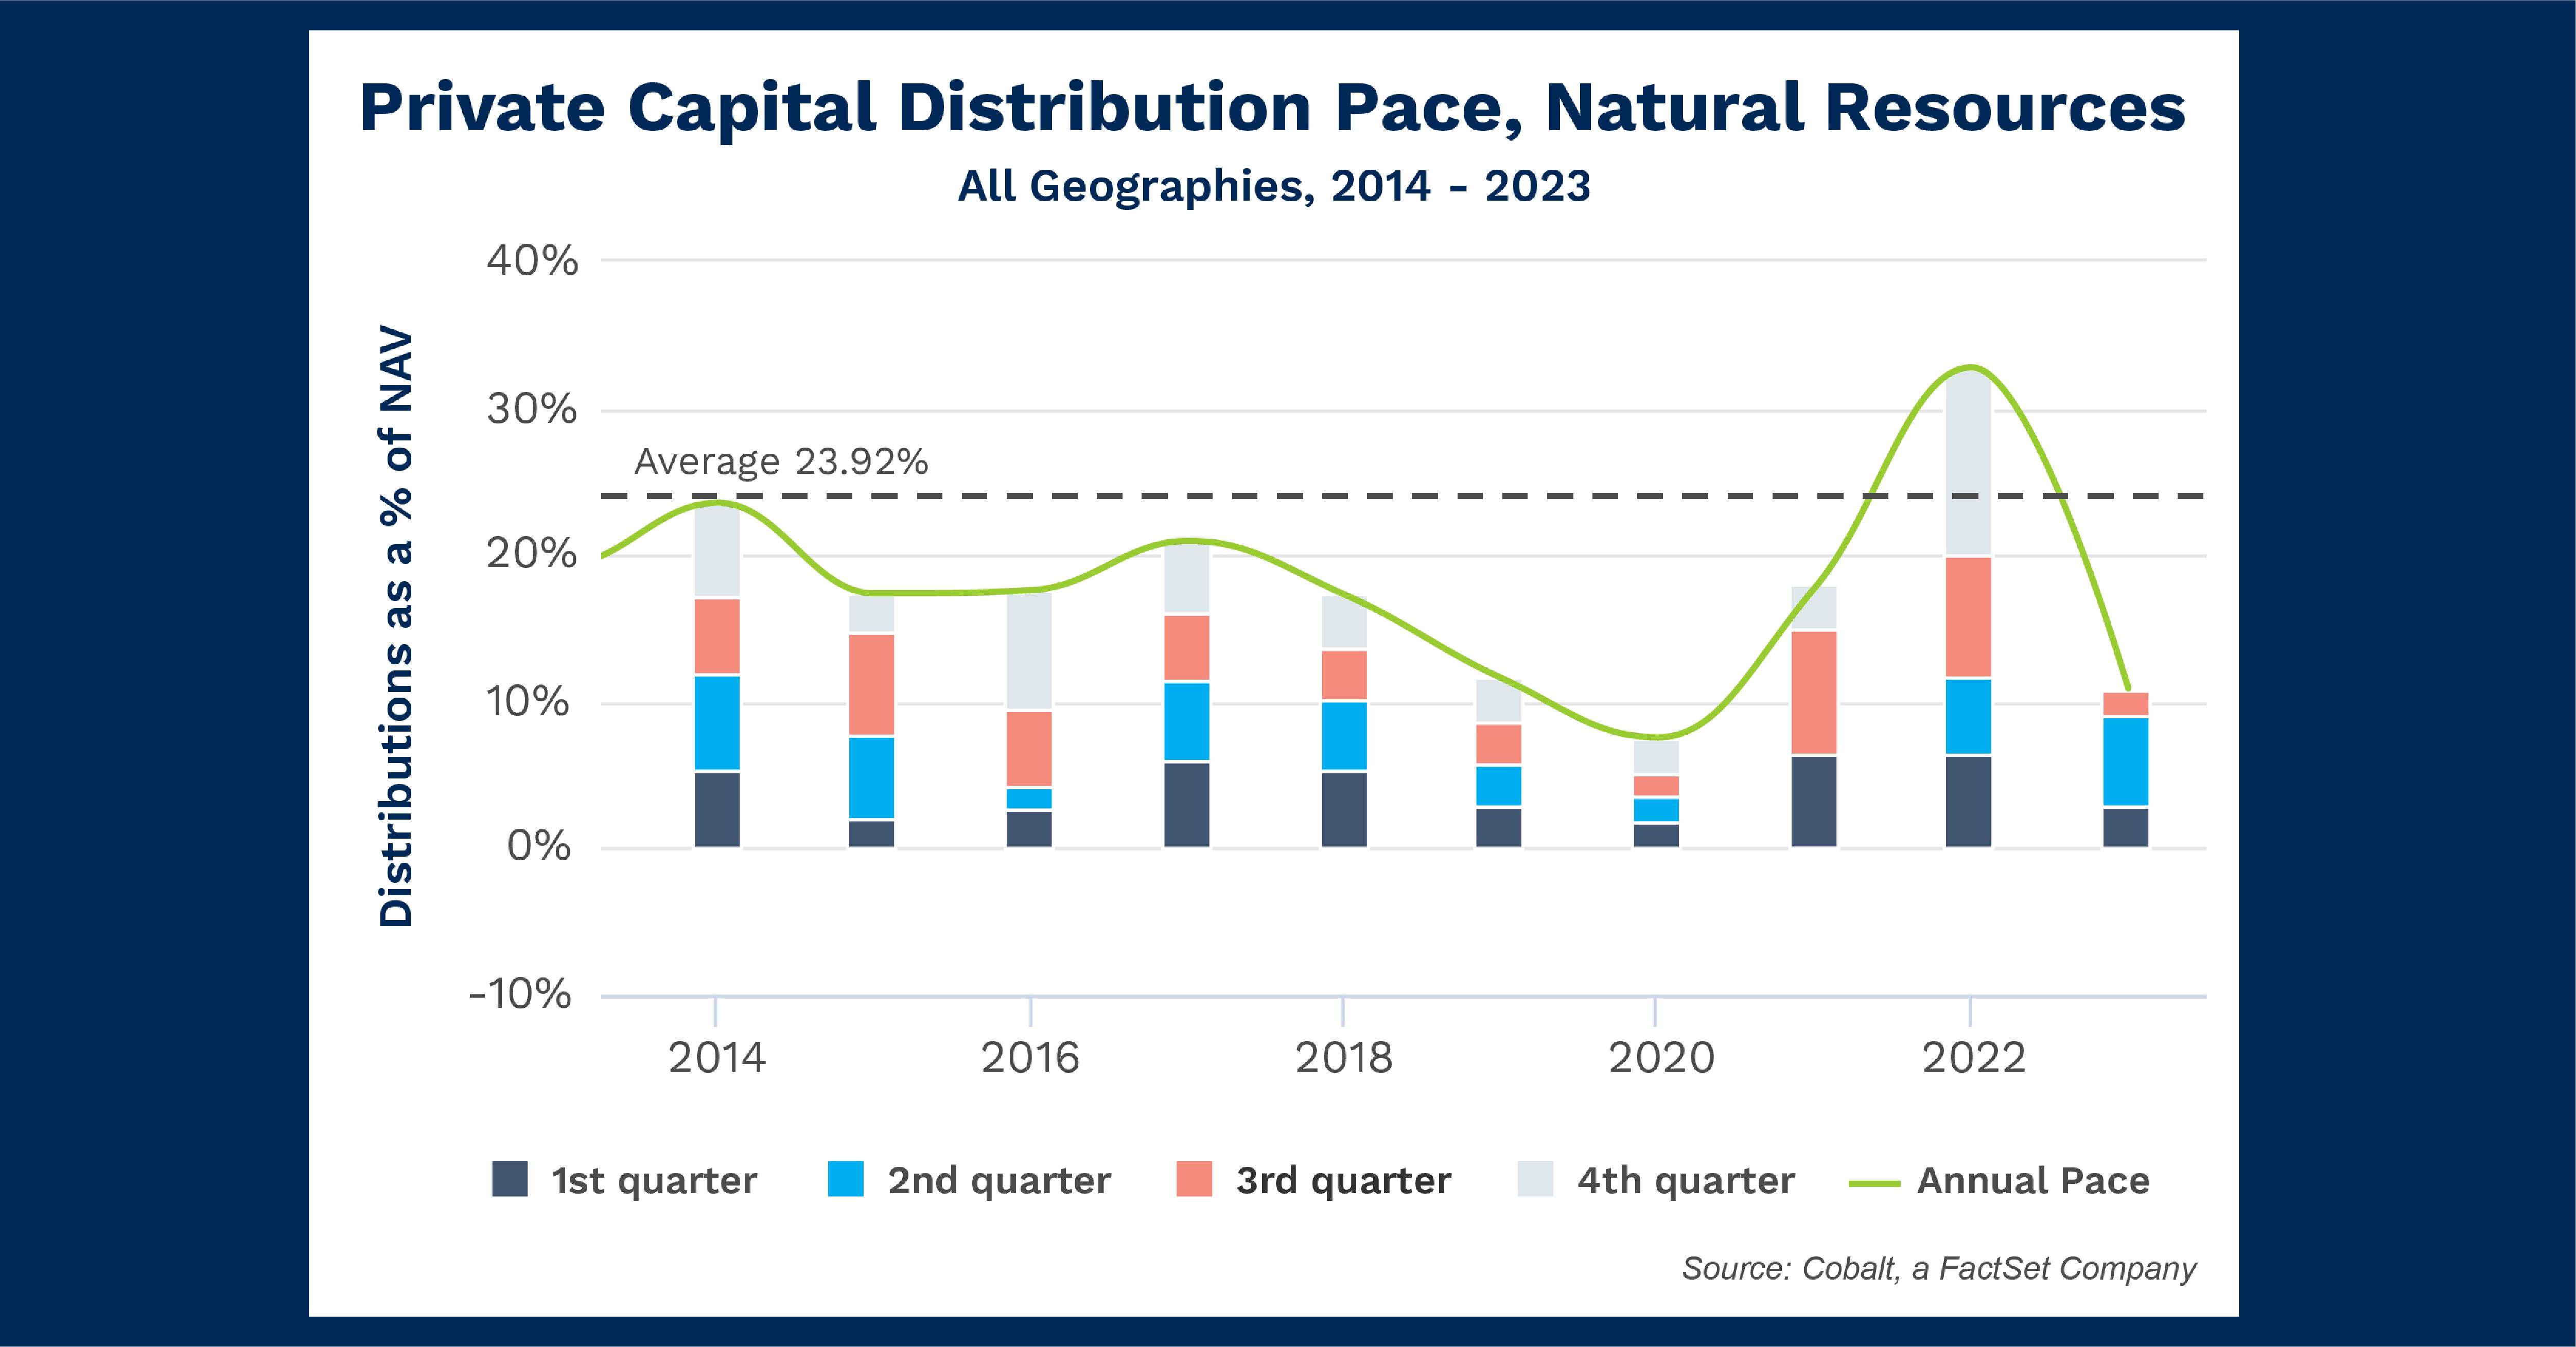
For the analysis, we focus on the pace at which distributions are being made in that strategy across all geographies over the last 10 years. (distribution pace = distributions as a % of NAV).

Key Takeaways
The most evident trend in the chart is the steady downward trajectory throughout the 2020s, from a high of 23.5% in 2014 to the low of 11.6% in 2019. This mirrors the trend in the public markets in that timeframe, with the S&P Global Natural Resource Index peaking over 2900 in 2014 compared to a high of only 2500 throughout 2019. This reinforces that Natural Resource saw decreasing fortunes through the decade, even as many other industries thrived.
This trend continued to an even larger extent into 2020, with only 7.6% pacing throughout the year, the lowest since 2009. As COVID greatly impacted all markets earlier in that year, Natural Resources continued to struggle in the latter half as well with each individual quarter all returning < 2.5%.
The span of 2021 – 2022 proved to be a strong bounce-back period, with 2022 returning a high of 32.8% in the timeframe. Although 2023 isn’t quite on pace to match that recent strong form, it should reach roughly 14% – 18% depending on the final Q4 numbers. That would fall in line with many of the average years of the 2010s.
Looking Ahead
The Natural Resource Index saw 3.7% growth in Q4 2023, so while not a 1-to-1 comparison to the trends seen over the past decade, this is a sign we may see a healthy Q4 posted once numbers are finalized. The same index has also seen a strong 2024 thus far, so we should continue to see the 2020 dip in the above chart as an outlier in an otherwise strong recovery from the downturn throughout the 2010’s.
The questions raised by this conflict will be interesting ones to monitor throughout the decade. The dynamic between LPs and large companies when it comes to investment horizons and ESG policies will continue to play out and have large impacts on these investments moving forward.
Subscribe to our blog:

Is There Geographic Bias in Macro Liquidity Trends in Private Markets?
Is There Geographic Bias in Macro Liquidity Trends in Private Markets? Building on our previous analysis of the role of…

Private Equity Performance: Large Strategies Versus Funds of Funds, Co-Investments, and Secondaries
Private Equity Performance: Large Strategies Versus Funds of Funds, Co-Investments, and Secondaries In private equity, the large strategies of buyouts,…

Examining Tariff Policy Impacts on Private Fund Contribution Rates
Examining Tariff Policy Impacts on Private Fund Contribution Rates Recently we examined the impact of Latin America presidential elections—which carry presumptions…