blog

Chart of the Month: May 2022

May 2, 2022

The Rolling Stone Gathers Momentum: Resilience and Investor Interest in Eastern European Markets

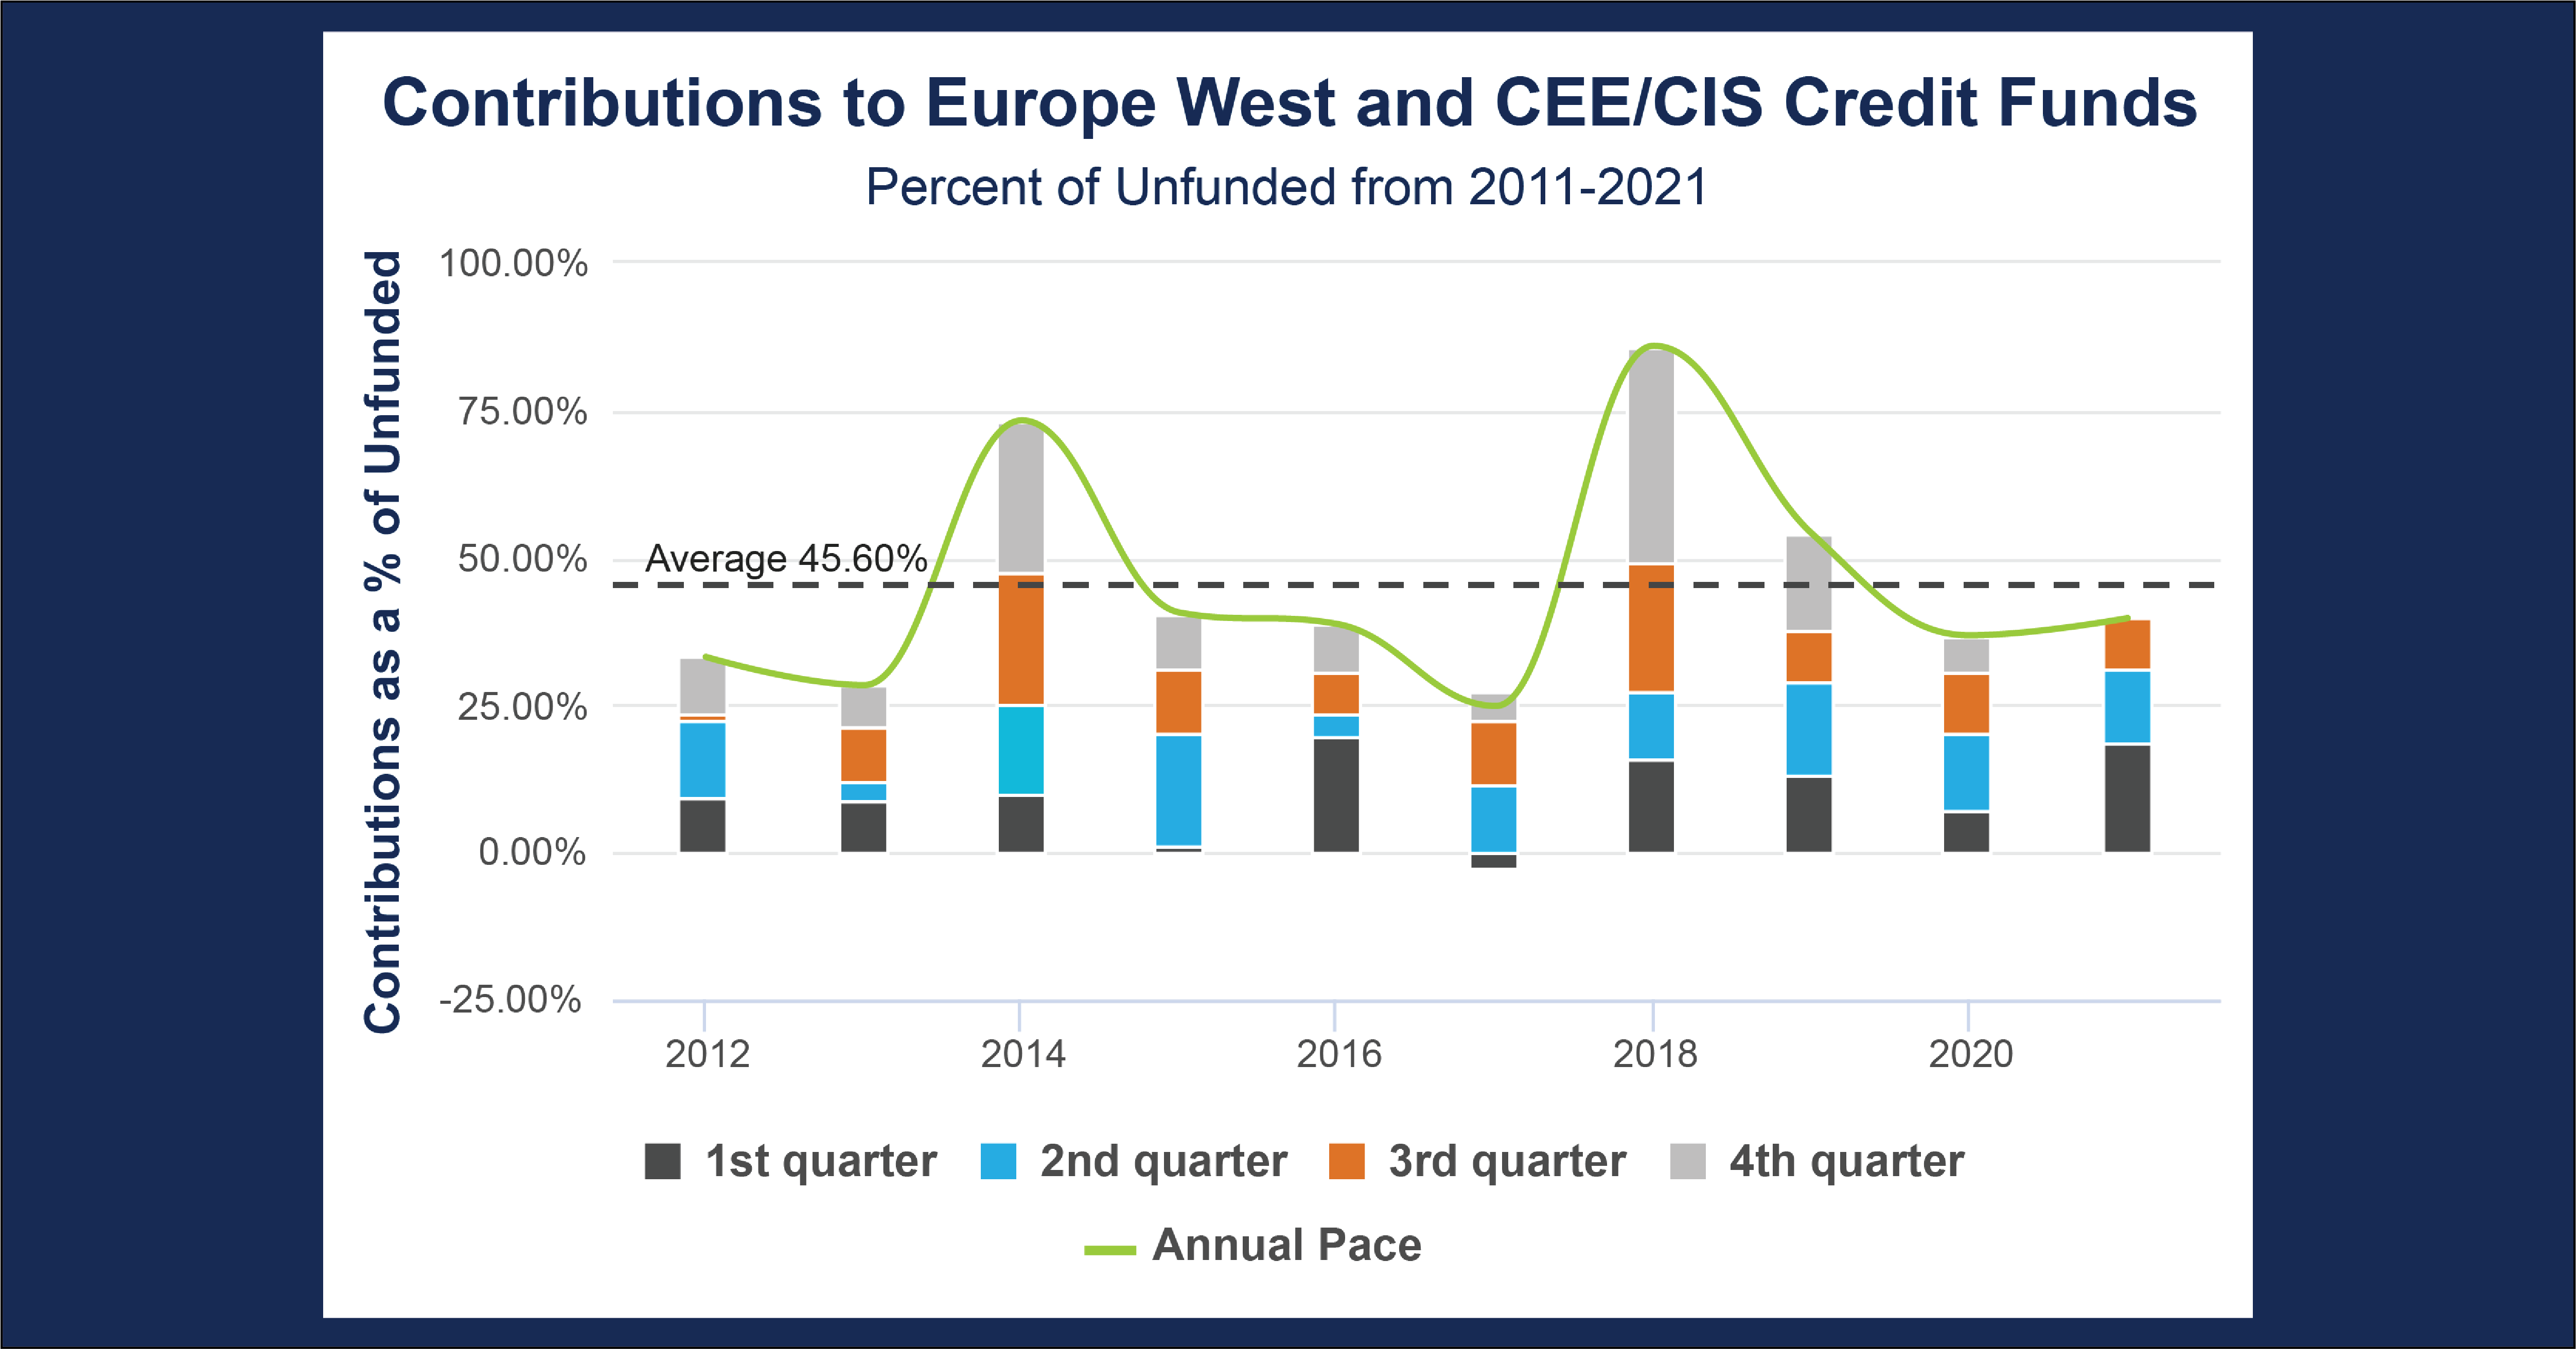
Eastern Europe has come to the forefront of current events this year with the conflict in Ukraine. Continuing our exploration from last month , we wanted to examine the private equity landscape of the region, given that it is often underexplored compared to the Western European markets. With that in mind, we used the Cobalt Market Data to analyze the total cash flows from 2010-2021 in Central and Eastern Europe.

Key Takeaways:

  • At the start of the decade, distributions were few and far between. This could largely have been due to the recession immediately preceding the 2010’s, as distributions across the board were suppressed throughout the market.
  • Conversely, contributions were still being made at the start of the decade, and the distributions finally did follow. Starting in 2015 and peaking at the end of 2017, the region accounted for over $3.2 billion in distributions in the middle of the decade.
  • These cash flows happened despite the Crimean conflict in 2014, as well as debt crises in the area, and the announcement of the Fed Tapering plan taking place in the same year. This may point to investments, at least in the private markets, proving to be resilient in the area despite surrounding uncertainty.

Looking Ahead:

  • Given the current unfolding situation, it would be foolish to say with confidence where the market is headed as things change from day to day. That being said, with Russia Ukraine being some of the of the largest economies in the region, the negative effects on the greater economy may be felt in the private markets.
  • After a brief period of lighter investment, the region did see an influx at the end of 2019. Based on the past trend from earlier in the decade, we may see a similar string of distributions 3-5 years later under normal circumstances. Time will tell if these will still be able to happen on schedule in the current climate.


blog

What Every PE Should Know About Portfolio Data Quality

April 26, 2022

Data, they say, is the new oil. And just like petroleum, raw data needs to be cleaned and refined before it’s a useful fuel. For few is that more true than private equity managers, which must keep track of hundreds of data elements for each of their portfolio companies.

This was the theme of a recent Webinar for fund general partners titled “Value In, Value Out: Business Intelligence Starts with Quality Portfolio Data.” During the event, Hank Boggio, chief commercial officer at Cobalt, offered that “Rather than a necessary evil, portfolio company data is the backbone for reporting and analysis, often driving strategic firm decisions.”

The webinar drew on the experience of Cobalt, a leading provider of portfolio monitoring software, and Alvarez & Marsal, a consulting firm with expertise in private equity performance improvement and analytics.

Here are four of many insights from the event that might surprise general partners (GPs):

Collecting data from portfolio companies saps productivity.

A typical small or midsize private equity manager typically gets financial updates by email from portfolio companies, with an associate copying data to spreadsheets. The data is often copied again from the spreadsheet into reports for partners and updates sent to investors. Taken together, all this is a drain on the firm’s resources. “General partners tell us on a regular basis they want to ensure that the investment team spends less time collecting and re-keying data and more monitoring and managing the companies in their portfolio,” Boggio said.

More data has more problems than most understand.

The ad-hoc process for gathering information too often doesn’t spot errors and inconsistencies in the data provided by companies. All that manual copying, in fact, introduces more. “If you haven’t taken a close look at the state of your data, you may not really understand the problems you have,” said Cole Corbin, the senior director of fund analytics and reporting services at Alvarez & Marsal. “We’ve seen all kinds of issues, from major integrity problems to cases where like-for-like comparisons were not being done right.”

Employee turnover can undermine data.

Another consequence of informal approaches to collecting information is that a lot of critical knowledge about the process is in the minds of a firm’s investing staff. Experienced associates not only know how to transfer information from company reports to your internal spreadsheets, they also can spot anomalies and errors. “In these times of the Great Resignation, we’ve seen GPs look for ways to lessen their reliance on individuals to collect and organize their data,” Corbin said.

Automating data collection improves data accuracy and saves time.

Instead of manually entering information, GPs have a few options to automate data ingestion into a portfolio monitoring software (such as Cobalt). These workflows can be designed with logic that flag errors and other data-quality problems. They can spot internal inconsistencies, e.g., when the revenue line items don’t add up to the total. And they can alert the investment staff if any data element changes unexpectedly from prior periods.

The webinar also explored how portfolio monitoring software can identify risks and opportunities in private equity portfolios. These analytical tools can be very powerful, but only if the data they are based on is reliable. “The basic mechanics of collecting the financial, operating, and performance metrics from each portfolio company is very repetitive and highly prone to error,” Boggio concluded. “As with any data-centric system, ensuring that the information captured for reporting and analytics is critical.”

Watch a replay of the webinar here:

blog

User-Centric Product Dev: Cobalt’s Approach

April 15, 2022

Cobalt is an industry-leading FinTech company for more than just its technology. At Cobalt, we believe that when we listen to our clients and put their feedback first, our product will be the best in the industry. Our client-centric approach to product development is our product strategy. We take action on client feedback and implement it on our platform as efficiently and effectively as possible. 

Cobalt’s Customer Success and Implementation teams are hands-on with every client starting on Day 1. These teams, in addition to our Product Development team, solicit client feedback on an ad-hoc basis to continually improve the user experience on the Cobalt platform. We conduct research and discovery calls with everyone on the team, not just senior leadership. 

In addition to the ongoing ad-hoc feedback, there are many other ways that Cobalt looks to garner all-important client and partner input.

“Our goal is to improve day-to-day efficiency for every user at the firm”, explains Ashley Smith, Head of Customer Success and Implementation at Cobalt. “We conduct regular feedback sessions with clients and partners to identify opportunities for improvement, and we even run ‘a day in the life’ work sessions to support development of new workflows and products”.

The feedback loop is always alive and well at Cobalt with its Live Chat function and regular “office hours” for clients. While much of the feedback that has been received is applied throughout Cobalt’s products and workflows, it is also on full display within an additional unique Cobalt resource, the Knowledge Base. This application allows clients to access real-time support through step-by-step guides, how-to videos, and detailed descriptions of the most-utilized features on Cobalt’s platform. And “Tip of the Week” emails curate and share the most timely and useful updates as well.

“Some of the most successful organizations (think: Apple) employ a user-centric approach, and the way we build our platform is reflective of that,” says Emily Monaghan, Chief Technology Officer at Cobalt, “Cobalt’s Customer Success and Design Teams gather feedback from all of our clients and then incorporate that collective insight directly into our product roadmap.” 

Regular client and partner design sessions for UX enhancements are another example of a forum in which Cobalt designers are able to garner feedback efficiently and apply it to the interface to make it even more user-friendly.

Through all of this, an ancillary yet significant benefit to Cobalt clients is that each of these sessions also provides a forum for private market firms to be able to network with one another – it is a platform to discuss and implement best practices and solutions that ultimately drive performance. By providing clients with connectivity across the top PE and VC firms globally, Cobalt enables a secure and essential space for knowledge sharing.

Have questions? You can reach out to our Customer Success Team at customersuccess@cobaltgp.com.

blog

Chart of the Month: April 2022

March 31, 2022

The Suspension Bridge Loan: Examining European Credit Contributions

Given the recent turmoil in Europe, we wanted to examine how the level of investment into the region has changed in the past decade.  Using Cobalt Market Data and Analytics Engine, we analyzed the rate of contributions to credit funds in the wake of the European debt crisis to see how investor sentiment reacts to instability in European markets.

Key Takeaways:

  • There are two notable peaks of contribution in the above graph: 2014 and 2018. The first surge of investment occurred in the latter half of 2014, as GPs drew down about half of their unfunded commitments in these two quarters alone.  The reasons for this are myriad, but do largely draw from the prior crises.  The year saw renewed concern towards the Greek debt crisis as well as Euro devaluation against the dollar amidst an announced Fed tapering plan.  2014 also featured the climax of Ukraine’s Euromaidan unrest and conflicts with Russia.  As a result, investors likely found the continent’s instability as a ripe opportunity for further investment into a temporarily distressed market.
  • The second notable shift in 2018 was even more dramatic, with General Partners again piling significant contributions into credit in the latter half of the year. December of 2018 was a famously bad month in the public equity space around the globe.  Europe was no stranger to these drawdowns: experiencing sideways movement throughout the year until fears of US monetary contraction and economic disputes with China would drive global markets south.  Strong dollar policies may have led some investors to look outside the USD for returns and the opportunity of a weak Euro offered promising growth prospects in the short to medium term.

Looking Ahead:

  • Looking at the two recent spikes in credit investment, we can see that these are unsurprisingly fueled by economic drawdowns and uncertainty. As all eyes turn to the rise of European self-determinism amidst the present conflict, there may be significant economic changes, and therefore opportunities in the credit investment space.
  • As we look further ahead, it’s important to note that significant events can often ripple forwards, and any debt fallouts from the present instability may be revisited several times in the future as we saw in the example of 2014’s debt crisis. These risks and opportunities may raise their heads once again in the not-too-distant future.


blog

Chart of the Month: March 2022

March 1, 2022

Road Repair: A Comparative Study of Regional Infrastructure Investment

This month’s chart takes a closer look at the infrastructure landscape we analyzed back in August of 2021, and digs into the varying performance across geographies. Using the Cobalt Market Data, we looked at infrastructure funds from the past 10 years across North America, Western Europe, and Emerging Asia by IRR to understand how the investing landscape may be different across regions.

Key Takeaways:

  • Emerging Asia has offered the greatest returns over the past decade, with the highest top-quartile group, as well as the highest median IRR of 12.72%, compared to 11.08% for North America and 9.63% for Western Europe.
  • Western Europe offers the ‘safest’ option, with the lowest spread between the 1st and 3rd While not having the upside of the other 2 regions, Europe has given the most stable range of returns over the past 10 years.
  • Conversely, North America has the widest range of outcomes, with the lowest range for bottom quartile performers. While this could be attributed to the sheer number of North American infrastructure funds, the numbers do tell the story of a high-risk, high-reward investment environment.

Looking Ahead:

  • A number of global events should come to shape the next decade of infrastructure investment. Globally, the post-pandemic recovery will continue weigh heavily on resources put towards infrastructure. And while it may not persist for the duration of a vehicle with a 10+ year investment horizon, the supply chain issues being seen across the world may come to play a factor in this space as well.
  • In China, the Evergrande fallout may reverberate throughout the investing landscape of real estate and infrastructure in Emerging Asia.
  • In North America, the recently passed infrastructure bill will inject trillions of dollars in projects into the space, and it will remain to be seen how this affects the performance of the players in the space.
blog

Chart of the Month: February 2022

February 1, 2022

Outsized: Examining Three Index Returns Since 2009 with a Fund Size Factor

This month’s chart takes a slightly different approach and evaluates the factor of fund size and the effects it has had on recent performance returns in large markets.  To visualize the impact, we used Cobalt Market Data to pull two charts over the last decade: the first examining smaller funds with size under $1 billion, and the second looking at larger funds with size over $5 billion.  While the data on these large funds is largely concentrated in more recent years and may suffer from a smaller sample size, the chart still captures valuable characteristics of the effect that fund size has on performance.

Key Takeaways:

  • Firstly, these returns are clearly very similar in the first five years. Across the board, there was positive performance on average regardless of fund size. Given that this was the early years of the post-GFC bull market, a strong, albeit slightly volatile, performance return makes sense to see.
  • As we look at the later years, we start to see some patterns emerge. Real estate exhibits the lowest volatility in both graphs, and quite similar overall levels of performance. Regardless of size, the charts follow very similar timings of peaks and troughs, as well as in depth of deviation in drawdowns. This indicates that real estate’s consistency in performance is size agnostic. Since real estate is so consistent, its performance should stay constant as fund size is scaled.
  • By contrast, infrastructure and credit show significant deviations between the small and large samples in the later 2010’s. Overall, we see a trend of lower volatility in smaller funds, which may be somewhat explained by sample size. However, there are exceptions such as the sustained drawdown of small fund infrastructure in 2017. This is not present in the large fund plot, which exhibits volatility with an average a little above 0%.  Meanwhile, large fund credit exhibits consistently higher volatility, even through the 2020 drawdown and recovery. Examining these cases, we see that in some styles a size factor can emerge. In more speculative styles such as credit, size can yield economies of scale in performance, but with some leverage resembling risks. On the other hand, different fund sizes may be operating in different markets as seen in infrastructure’s disjointed performance.

Looking Ahead:

  • As the prevalence of large funds rises, we will see the greater robustness of the data on these firms as volatility will likely drop as sample size increases. Additionally, with the dramatic upswing in M&A over the past year, it is quite likely that we will see significant changes in volume of larger firms.
  • While real estate will likely continue to be size agnostic, we have seen eight out of the ten largest infrastructure funds raised over the last five years, demonstrating an impressive push for larger infrastructure investment. That may create a disjointed market from its smaller counterpart that could become further separated as the large fund space increases.
  • For credit, while greater fund size appears to allow greater scaling returns, those same returns may offer some pause to investors seeking safety. Since dampening volatility has not appeared over time, credit funds’ reversions may continue to be most painful at the larger scale.
blog

Trustworthy Data: 5 Strategies for GPs

January 5, 2022

As private capital managers build more sophisticated technology that enables data-driven decisions, nothing is more disheartening than finding that the various systems the firm uses give different answers to the same question. If the computers can’t agree on the cost basis for an investment or even the phone number of an LP, why should anyone trust anything they say?

It’s no surprise then that a recent discussion about technology at private equity firms kept coming back to the quest for “the single source of truth.” The occasion was at the recent Intapp Connect Conference with DealCloud, a Cobalt partner, titled “Offense and Defense: How Finance Firms Build, Maintain, and Protect Data Ecosystems.” Participants were Rob Kaufman, Vice President for Investor Relations at FTV Capital (a Cobalt Client), and Chase Paxton, Director of Finance and Valuations at NGP Energy Capital Management.

Each professional emphasized both aspects of the goal:

  • Having only one answer for any question
  • Ensuring that the data was as close to the truth as possible

Here are the five most useful insights from the discussion:

  1. Consolidate to the “best-of-breed” system for each function.
    In theory, the best way to create a single source of truth would be to put all of a firm’s information into one system. In reality, Kaufman and Paxton agreed, no one software suite could handle all their needs. FTV has been trying to reduce the number of systems it uses. It consolidated a lot of data about investors and deals into DealCloud. But it concluded it needed specialized tools for a few other functions. “We’ve always had a best-in-class class technology ecosystem,” Kaufman said. “For portfolio company information, Cobalt will be the single source of truth. And Investran will be for accounting and finance data.”
  2. Connect all systems.
    NGP is reducing the potential errors from inconsistent information by connecting all of its systems together using application programming interfaces (APIs).“A lot of data gets captured in multiple places,” Paxton said. “We want to get away from producing a report in one system, and then someone manually puts it into another because that creates a lot of issues with a single source of truth. As FTV builds out its portfolio monitoring and accounting systems, it is keeping them separate from its DealCloud CRM. But it is using a design that will allow them to exchange information in the future.“The same portfolio company lives in DealCloud, Cobalt, and Investran,” Kaufman said. “We want some connectivity, so someone doesn’t have to look in multiple places to find information about a particular company,”
  3. Swear off spreadsheets.
    Perhaps the most important way firms can improve their data quality is to wean partners and staff from the spreadsheet habit.“We’ve got really good systems in place,” Paxton said. “We continue to need to make decisions at the firm not to store information in Excel. The more we can train the firm to put data in the system, the more successful we can be with our overall data strategy.This is more challenging than it sounds. While FTV also is trying to move all of its data into the cloud, Kaufman conceded that “I use a few Excel schedules all the time. They could live in the cloud, but I really like them, and someone is going to have to forcibly take them away from me.”
  4. Encourage self-service.
    One powerful way to ensure that data is accurate, Paxton said, is to encourage everyone at the firm, especially the partners, to interact directly with the systems rather than asking associates to print reports for them.“It’s important for the people that supplied the data to take ownership and see kind of what the output looks like,” he said. “The more senior leadership is using the dashboards and questioning the data, the better data quality that we get.”The work-at-home regime of the last two years has encouraged even more adoption of cloud systems by senior leaders, Kaufman observed.“Pre-Covid, we’d print three hundred pages reports for our investment committee meeting, and at the end of the day, you’d see piles of paper in the recycling bin,” he said. “Now we don’t print anything, and people are being much more resourceful about using technology.”
  5. Prepare for lots of questions.
    Investment firms are receiving a lot more requests for specific information from limited partners than ever before, often long questionnaires related to environmental, social, and governance (ESG) issues. To answer these questions efficiently and accurately, the firm has to commit to keeping its cloud-based systems up to date.“We got a hundred ESG requests last quarter,” Paxton said. “We want to be positioned to be able to easily not only show that information but also show the improvements that we’re making internally. The data, data quality, the analytics, and presentation are really significant.”

Read our latest whitepaper on how the right portfolio monitoring platform will help create a single source for your firm’s data:

blog

Chart of the Month: January 2022

January 5, 2022

New Year, New Trends: NAV vs. Dry Powder Over the Past Quarter Century

A New Year is the time for resolutions and change. With this mindset, we looked back at the private markets to see where momentum has changed and the trends that have formed over the past quarter century. Using Cobalt Market Data Analysis, we identified the relationship between NAV (net asset value) and dry powder and how it has changed over the years, dating back to 1995.

Key Takeaways:

  • At the beginning of the pandemic in Q1 2020, NAVs started to diverge from the trend over the previous decade in which the pair rose at similar rates. NAVs now sit at roughly double the amount of dry powder in the market ($2.6T vs. $1.4T).
  • While NAVs have grown at an accelerated rate, dry powder has stagnated over the past few quarters, even decreasing slightly from Q4 2020 to Q1 2021.
  • The last divergence between NAVs and dry powder was seen after the last global financial crisis, from 2009 to 2011 when NAVs rose as dry powder decreased. This may have been caused by firms increasing their spending on distressed, undervalued assets in the wake of the recession, funded mostly by existing capital on hand. After this, the above-mentioned trendline was set, where both figures were rising at similar rates throughout the rest of the decade.
  • One explanation for this latest emerging gap between NAVs and dry powder is that even Private Equity has not been immune to the ‘everything bubble’ of the past 18 months. Valuations across various asset classes, such as public equity, have experienced similar exponential growth the past 6 quarters. As for dry powder, this growth has been seen organically, meaning firms didn’t have to raise higher amounts of capital than normal, or use an outsized amount of the current supply to achieve this growth. Because of this, we see dry powder staying relatively steady, rather than an upcoming large growth or depletion.

Looking Ahead:

  • Based on the previous financial crisis recovery, we should expect NAVs and dry powder to again align on a similar growth trajectory in the next 1-2 years. That being said, there are new circumstances and lingering factors (supply chain issues, inflation concerns) that may come to shape a different relationship between the two over the next decade.
  • No matter the relationship between the two trendlines in the near future, it seems highly unlikely that we will see dry powder surpass NAVs any time soon, as they last did in Q2 2009.
blog

Private Market Firms: Cobalt & FactSet Solutions

December 1, 2021

Taking Next-Level Portfolio Monitoring Technology to Private Market Firms Globally

Now, more than ever, private market firms have a growing need for a complete workflow solution that connects differentiated data with sophisticated tracking and portfolio reporting.

Cobalt’s Portfolio Monitoring platform provides private market firms with intuitive technology for collecting, analyzing, and reporting on fund and portfolio company data. FactSet is a global provider of integrated financial information, analytical applications, and industry-leading service.

Together, Cobalt and Factset will deliver an end-to-end solution for private market firms to simplify their investment processes. The features and benefits of Cobalt, a FactSet company, include:

  • Advanced data & cash flow analytics
  • Personalized fund and portfolio dashboards
  • Flexible, recurring performance reporting
  • Top-tier data sets & investor intelligence
  • Excel plug-in & APIs
  • Dedicated client support and consulting

Schedule a call below to learn about Cobalt + FactSet’s Private Market solutions:

blog

Chart of the Month: December 2021

December 1, 2021

Across Two Ponds: Taking Another Look at Regional Real Estate from 2010-2021

As the true extent of the cracks in China’s real estate market continue to unravel, we thought it would be prudent to examine the market again after October’s Chart of the Month, namely looking at the quartile breakdown of the three dominant real estate markets. We analyzed the dispersion of returns by geography from 2010-2021 to further illustrate how far each market strays from the internal rate of return (IRR) medians presented in the prior chart.

Key Takeaways:

  • Unsurprisingly, we once again see the median IRR settle around 9-10% across all regions. However, we begin to see significant differences in the upper quartile, as the European and American funds demonstrate far higher upper fences in the upper quartile than their emerging Asia counterparts. Despite very high interest in emerging markets, this shows the sheer popularity of European and American real estate and thereby its ability to appreciate in value.
  • On the loss side, North American and European investments do show closer lower fences in their lowest quartile. Surprisingly, emerging Asian markets also show a wider lower quartile for their overall volatility. This would indicate that compared to their relative stability in other levels of performance, when confidence erodes in low-performing investments, there is far lower fundamental value cushioning for these investments.

Looking Ahead:

  • When we look at this chart compared to October’s, we see much the same data: all three markets display relatively similar average upsides with fairly low overall risk. We can now see that through another lens there are fair concerns about the health of emerging Asia real estate. In light of its recent shocks, can its lower historical upper quartiles and reasonably low lower quartiles provide the investor the interest needed to sustain their level of investments?
  • Of course, the other markets have their share of risks as well with North American markets being accused of inflated value. A burst bubble could easily emerge amid rising interest rates and stabilizing work environments, reducing the retail demand for new home ownership.
  • On either side of each ocean, we see a real estate market historically behaving as expected: profitably consistent. Only time will tell to see which market buckles the worst under the looming specter of cooling demand, if it ever truly arrives.