blog

Chart of the Month: November 2021

November 1, 2021

Birds of a Feather: A comparison of Growth Equity and Late-Stage Venture Capital

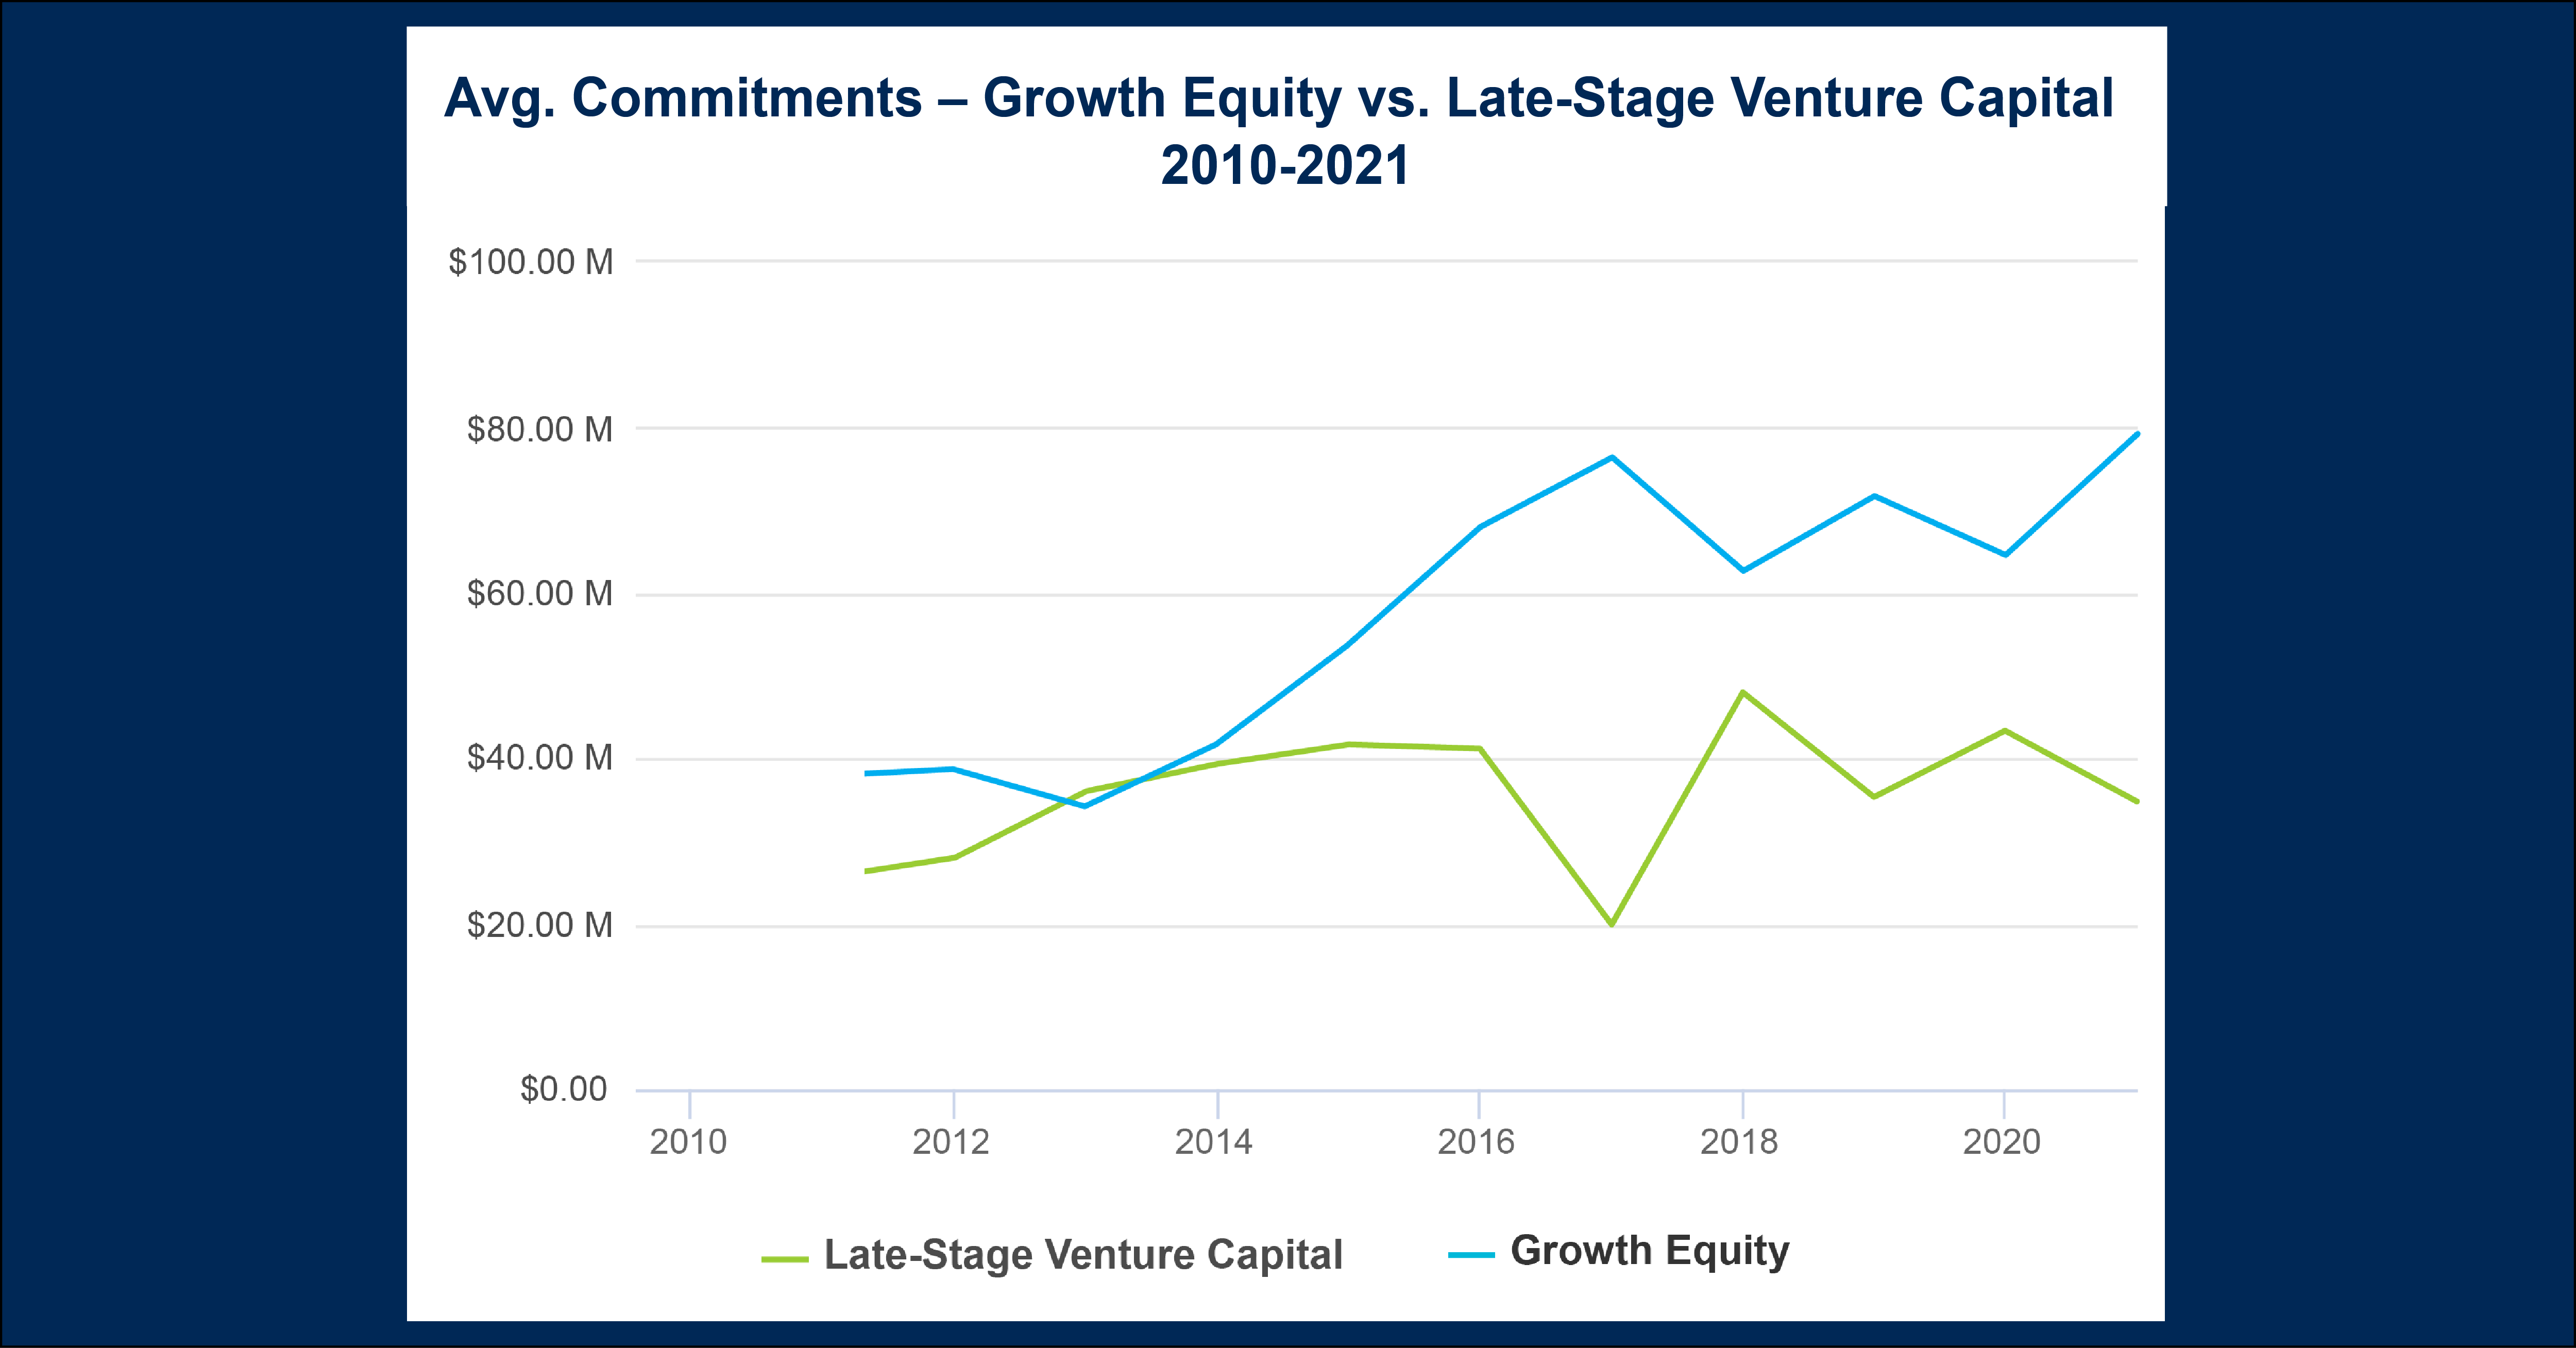
Growth Equity and post-seed Venture Capital are two styles often seen competing for the same deals within the private markets. This month’s chart uses Cobalt’s Market data set to take a deeper dive and understand the difference in how institutional investors approach these seemingly similar investment styles. To do this, we’ve taken the average commitment size for each style from 2010-2021 and plotted out how they have changed from year to year.

Key Takeaways:

  • Growth Equity and Late-Stage Venture Capital commitments merged closer after the recession, with average VC commitments surpassing growth for the only time all decade in 2013. After this vintage year, the trends start to clearly diverge.
  • In the past five to seven years, investors are leaning towards larger investments in growth equity, cutting larger and larger checks on average compared to late-stage VC investors.
  • One explanation for this divergence is that Growth Equity is seen as a potentially safer investment compared to late-stage Venture funds. This is most apparent in 2017, 2019, and 2021, with over $40 million gaps in average commitments between the two styles.

Looking Ahead:

  • This trend gap may persist as the world continues to navigate through COVID, since investors continue to see Growth Equity as the safer of the two investment options.
  • An alternative scenario is a trend reversal, as late-stage tech startups may be better positioned to excel in a more remote world.
  • Moreover, late-stage VC may be a beneficiary of recent trends in the market, as investors react to the IPO & SPAC frenzy of the past year by rotating back into the style.
  • The popularity of credit funds and buyout funds looking to take advantage of distressed companies may also overtake commitments for the coming vintage years, which would leave less dry powder for Growth Equity and late-stage VC.
blog

Chart of the Month: October 2021

October 5, 2021

The Hollow Pendulum: An Examination of Regional Real Estate from 2009-2020

In the wake of the Great Financial Crisis (GFC), there was an incredible buying opportunity that led many private market firms to invest in the highly-distressed real estate sector.  However, recent panics from the Chinese Evergrande crisis raises the question of whether or not the foundations of the recent boom are showing cracks.  As such, this month’s chart analyzes real estate performance since the GFC to see how certain regions performed during the last decade with a focus on the risk taken.  Specifically, we used Cobalt Market Data’s risk/return feature to compare a money weighted loss ratio to estimate risk of loss for a typical fund with a large cap bias.

Key Takeaways:

  • Each of the regions we examined had relatively similar performance, with all three returning a median IRR in the 9-9.5% range. This demonstrates the safety and reliability that real estate has offered through its long-standing and stable appreciation.
  • Risk-wise, we see two groups emerge. The European markets have exhibited much higher risk than the North American investments for nearly the same level of return, likely the result of European areas with stagnant or less reliable real estate markets.
  • The most surprising sector, despite the low sample size, is the emerging Asia real estate. It boasts slightly higher returns than the North American juggernaut with even less apparent risk.  While the higher returns are no surprise for a rapidly-developing region with high investment interest, the shockingly low accompanying risk raises questions over sustainability and completeness of data.  Can this emerging market continue to outperform with little risk of failure, or are we only seeing part of the picture?

Looking Ahead:

  • In light of the recent news out of the Chinese real estate market (the leader in the Emerging Asia sphere), it questions whether we are seeing this outperformance crack and revert back to a more sustainable level.
  • Contrarily, the region’s continued status as “emerging” means that it will continue to attract substantial external and internal investment and could continue to deliver top line performances, perhaps with slightly higher risk allotments.
blog

Chart of the Month: September 2021

August 31, 2021

The Amber Wave: A Look at North American Buyouts Compared to the Russell 3000

Given the volatility of the past year’s returns across the broader markets, we took a wide look at a fundamental point in question: the state of public market vs. private market returns.  We plotted the Russell 3000’s PME against the returns of North American Buyout funds using our in-house PME calculation to see what characteristics each side of the market have demonstrated over the past 20 years.

Key Takeaways:

  • Between the Dot Com bubble and the Great Financial Crisis (GFC) we can see a strong period of outperformance from the private market sample above, routinely outperforming the public market benchmark by 5-10%. This gap shrunk as the GFC approached since public markets tend to see progressively higher performance several years after a recession as public bull markets pull high-capital interest.
  • In the aftermath of the GFC, both markets would remain relatively steady and even. However, after 2012, strong re-investment into private markets would once again push a widening of the performance gap.  Private markets’ long horizons give an ability to invest more heavily into recessions, resulting in a much quicker uptick in performance coming out of recessions than seen in public markets.
  • After 2016, the IRR’s exhibit higher variance than their long term returns on account of the short time that has elapsed since inception. Nevertheless, we can see a continual push towards parity as both public and private returns continued to climb higher in the late 2010’s bull market, feverishly pushing for performance on all fronts.  Private equity’s long-term horizon is responsible for this short term volatility, but a smoothing effect can be seen in a fund’s performance during economic downturns and throughout the full life span of a fund.

Looking Ahead:

  • Notably absent from this examination is the recession of 2020, as the pandemic created sharp but brief drawdowns in public equities. We wait to see if the private market advantage of investing into recessions once again sees a return to dominance.
  • However, the brevity of the 2020 recession and the rapidity of the recovery could allow public markets to close the gap far faster than prior recessions.
  • Given the public/private comparison of bull market run-on strength vs. recessionary opportunity evident in the recent past, it will be interesting to see if these behaviors remain, or if macroeconomic forces alter the standards of outperformance.
blog

Monday Morning Meetings Just Got Easier

August 5, 2021

Mondays are arduous enough without all of the stress and pressure that naturally comes with those inevitable morning meetings. Precious hours that should be allocated towards productive, consequential tasks are instead wasted on gathering information and creating reports.

In the world of finance, efficiency is paramount – and this was the inspiration behind our new portfolio management software. After all, there’s always so much to do and only so many hours in a day.

That’s why Cobalt is changing the way private equity firms report forever. Our cutting-edge portfolio monitoring system lets fund managers customize and automate reporting as they see fit, replacing daunting tasks with rewarding results. Prioritize what’s important with tailor-made dashboards that highlight the goal-oriented objectives that matter most:

Cobalt’s Portfolio Monitoring Platform lets private equity firms:

  • Leverage customized portfolio company tear sheets for optimal meeting preparation
  • Tap into aggregated fund and portfolio analytics for the latest insights
  • Zoom into any portfolio company on demand for data-driven intuition
  • Access much-needed reports from the office and beyond
  • And so much more

With Cobalt, you’ll have compromise-free access to your fund performance, whenever and wherever.

The last thing you want before a big meeting is chaos, so isn’t it time we made Mondays a little easier? Request a demo today:

blog

Chart of the Month: August 2021

August 2, 2021

If You Build It, Will They Come: An Examination of Infrastructure Fundraising Over the Last Two Decades

With the Infrastructure Bill yet again becoming a top priority on Capitol Hill, we dug into Cobalt Market Data to analyze how the infrastructure landscape has changed within private equity over the past few decades. In the chart below, we’ve taken the total amount raised by all infrastructure funds in our dataset and broken out by vintage years from 2000-2019.


Key Takeaways:

  • The infrastructure sector has seen consistent growth over the past two decades, particularly since the tail-end of the great recession in 2009. The fundraising peak came in 2018, totaling over $104 billion. This growth follows the overall uptrend of money into private equity and can also be tied to institutional investors carving out a larger allocation of their portfolio for infrastructure and real assets.
  • There has also been a shift in the structure of the funds being raised; the total number of funds raised actually peaked in 2013 and 2014 as the dollar amount raised continued to rise throughout the rest of the decade. This shift is reflected in the average amount raised for each fund by vintage year, which has been above $1 billion for every year since 2015, peaking in 2017 at nearly $1.8 billion.
  • A contributing factor here may be the rise of mega-funds within infrastructure, with all 10 of the highest-raising funds in the sector growing since 2015. This shows that while the overall pool of funds is growing, larger totals are being concentrated into the big players in the space that have the resources to raise 11-figure funds.

Looking Ahead:

  • The next few years in infrastructure investing may depend on the decisions made in D.C., but based off of our analysis there also seems to be plenty of momentum for growing capital in the infrastructure space regardless of outside forces.
  • It will be interesting to see if the concentration of these mega funds continue, with the larger players raising even larger funds, rather than the swell of new firms in the space being the driving force behind growing amounts of capital being raised.

blog

Personalized Dashboards: The Operations Team

July 22, 2021

The Private Equity Operations Team needs a way to show management that the Deal Team is executing on their value creation plan and that the firm’s portfolio continues to grow. In the dashboard below, we’ve included key financial elements that every operations team should include as they prep reports for quarterly portfolio meetings.

Key elements of our best-practice dashboard for the growth-focused Operations Team include:

  • Portfolio Company Overview which includes fully-editable text fields for the company description, deal team lead, and debt obligations. This dashboard also pulls in calculated performance metrics such as NAV, MOIC, DPI, and IRR.
  • Net Debt / EBITDA and Senior Debt / EBITDA being shown comparatively against their covenants. Whether it is budget numbers or covenants vs. your actuals; being able to show multiple versions of metrics across your portfolio companies in chart format is highly beneficial.
  • Interest Coverage Ratio is similar to the above, but takes advantage of Cobalt’s unique ability to create calculated metrics (EBIT / Interest Expense = Interest Coverage Ratio) and apply that to dashboards.
  • Entity List Table showing related deals and their key information like acquisition date, capital invested, realized proceeds, remaining value, and gross MOIC and IRR.

Cobalt’s Portfolio Monitoring platform gives you the ability to personalize team and user-specific dashboards that are in-sync with the way your firm operates and reports performance. Users can create and customize dashboards on the fly and then easily export to professional, pixel-perfect PDFs that are always partner-ready. Request a demo of Cobalt’s dashboard capabilities today.

blog

Personalized Dashboards: The Investor Relations Team

July 13, 2021

Investor Relations professionals play a big role in satisfying LP requests and inquiries surrounding overall fund performance. Any IR Team needs to be able to quickly produce a professional report with up-to-date fund metrics and cash flow information. We created the dashboard below on Cobalt’s Portfolio Monitoring platform to include key reporting elements that capture big-picture fund performance for inquiring partners and investors.

Key elements of our best-practice dashboard for the Investor Relations team  include:

  • Key metric values including fund size, invested capital, gross and net IRR. High-level fund performance indicators give a quick snapshot of the funds performance.
  • Gross IRR vs. Net IRR Spread: When reporting to investors, it’s important to show both the IRR associated with the cash flows from investors to fund, as well as the cash flows from fund to portfolio companies.
  • Distributions & Total Value graph gives you an accurate timeline of when distributions are being made compared to the fund’s total value.
  • Schedule of Investments Table: the ability to seamlessly produce SOIs, organized by realized vs. unrealized, allows you to clearly visualize the performance of each investment and see the overall status of the fund. 

Cobalt’s Portfolio Monitoring platform gives you the ability to personalize team and user-specific dashboards that are in-sync with the way your firm operates and reports performance. Users can create and customize dashboards on the fly and then easily export to professional, pixel-perfect PDFs that are always partner-ready. Request a demo of Cobalt’s dashboard capabilities today.

blog

Chart of the Month: July 2021

July 2, 2021

The Tortoise and the Hare: An Examination of the Two Styles Driving Healthcare and Tech Investing

This month, we examined institutional interest in the Healthcare & Technology sectors from 1990 to 2019. We used Cobalt Market Data to break out our Limited Partner investments into these sectors by investment style in order to see the trends that emerge within each specific style.

Key Takeaways:

  • Though there seems to be cyclical interest in these sector-specific investments, the general trend is upward, illustrated by the 3-year average total investments per year of the main peaks (most evident in the VC trendline) over the past 20 years: 1999-2001; 272 Investments / year, 2006-2008; 351, 2014-2016; 465. This shows that institutions are impacted by external market factors that may cause the cyclical demand, but overall, the appetite for sector-specific funds has been growing since the turn of the century.
  • Interestingly, 2019 was the first vintage year in which sector-specific buyout funds surpassed venture funds in total investments since the early 90’s, when total investments in these funds was significantly lower. We also can observe that Buyouts have been steadily growing since the early 2000’s, while venture tends to react more cyclically around greater market events such as the Dot Com Bubble and Great Recession.
  • Two factors may be working in tandem to cause this uptrend. First, institutions may be turning more to sector-specific funds as an attractive tool for portfolio diversification, creating demand for more investments in the space. On the other side, Buyout firms are raising more sector-specific funds or starting out as sector-specific shops as another way to differentiate and create competitive outperformance in the overall buyout space. With more capital invested in the space and more landing spots for that capital, the steady rise in the buyout space over the past two decades begins to make sense.

Looking Ahead

  • Strictly based off of the historical chart pattern, Venture Capital investments look ready to reverse trend and approach the highs seen in 2000, 2007, and 2015 again. As well, the macro event of the pandemic last year may be the catalyst for higher venture investments, as healthcare will be a popular space in the coming half-decade.
  • Based off of past market events, this may have a more muted effect on buyouts, but we would still expect these funds to benefit as well and continue their uptrend that has been especially strong since 2010.
blog

Personalized Dashboards for IR Team

June 29, 2021

ESG-focused Deal Teams are under pressure to show transparent reporting and progress on their sustainable initiatives. In the dashboard below, we’ve included some key reporting elements that not only allow deal team professionals to incorporate ESG metric tracking into their reporting process, but still provide key financials and essential revenue updates to managers.

Best-practice reporting for a Deal Team with an ESG-focused Portfolio Company might include:

  • Employee Diversity Progression Chart gives users the ability to track the number of minority employees and the number of female employees compared to the number of overall employees. Many investors now expect GPs to keep up with ESG reporting and be able to display metrics such as diversity headcount. 
  • Detailed information on the portfolio company gives a high-level overview of both performance based metrics (e.g. NAV, MOIC, DPI, and IRR)  as well as qualitative fields and updates (e.g. Company Description and/or Investment Summary). These components can be displayed in multiple formats and layouts.
  • Revenue vs. Budget Table allows you to compare and contrast your budgeted metrics vs. your actuals using our comprehensive selection of graphs and charts. 
  • Key Financials and our charts library allows you to quickly create a financial table for any company tracking financial metrics. With the flexibility to show multiple versions (e.g. Actual & Budget), periods and layers in our conditional formatting, visualizing your key financials is made easy.

Cobalt has supported many firms with best-practices as they’ve started incorporating ESG metric tracking into their investment and reporting process. Our clients track and report on more ESG factors such as:

  • Environmental: CO2 emissions, water usage, energy usage 
  • Social: Gender pay ratio, employee diversity, injury rate
  • Governance: Board diversity, ethics and anti Corruption, data privacy

Cobalt’s Portfolio Monitoring platform gives you the ability to personalize team and user-specific dashboards that are in-sync with the way your firm operates and reports performance. Users can create and customize dashboards on the fly and then easily export to professional, pixel-perfect PDFs that are always partner-ready. Request a demo of Cobalt’s dashboard capabilities today.

blog

Personalized Dashboards: The Finance Team

June 22, 2021

Private Equity and Venture Capital Finance Teams need an investment-focused dashboard to report on all active investment performance and see updates in a recurring, automated way. In the dashboard below, we’ve included some key reporting elements that our clients from leading private market firms use on a daily, weekly, and quarterly basis to update their partners and respond to investor requests.

Key elements of our best-practice Investment Dashboard include:

  • Entity List including the acquisition date, capital invested, realized proceeds, gross MOIC/IRR, and remaining values for all attached deals. Investors often raise capital in multiple rounds of financing and our entity list allows you to see all rounds (entities) associated with a specific company.
  • Single Company Cap Tables show the pre-money, post-money, price / share and value / share for all active deals. The ability to see equity ownership, market capitalization, and market value all in one place allows investors to visualize their equity capital stake in each business as well as streamline shareholder reporting.
  • Key Financials such as revenue, cost of sales, gross profit, net income, EBITDA, adjusted EBITDA, and enterprise value. Our graphs and charts make it easier to analyze data on a period to period basis or when comparing a set of key financial metrics. With an abundance of formatting options (e.g. conditional formatting) to choose from, visualizing and identifying trends in your data is made easy.  

Cobalt’s Portfolio Monitoring platform gives you the ability to personalize team and user-specific dashboards that are in-sync with the way your firm operates and reports performance. Users can create and customize dashboards on the fly and then easily export to professional, pixel-perfect PDFs that are always partner-ready. Request a demo of Cobalt’s dashboard capabilities today.