blog

Cobalt’s Platform – Leap-Frogging Portfolio Monitoring Like Never Before

April 28, 2021

After years of market research and direct client input, our latest, milestone platform release is here and it’s raising the bar for portfolio monitoring tools. 

From day one, Cobalt has aimed to provide clients with unparalleled portfolio monitoring tools that free them to focus on their work. Now, we’re driving operational efficiency like never before, with an even more streamlined offering that provides exactly what our clients need, when they need it, in a format that works for every user. 

From our CEO, Jason Weinstein:

“With this new platform release, Cobalt has definitively leap-frogged the portfolio monitoring category on accessibility, sophistication, and value provided to private capital leaders and their teams. We are delivering an entirely new level of operational efficiency and insight for private capital firms. It’s the kind of sophistication the industry has come to expect from every technology they use, and now, portfolio monitoring need not be the exception.”


What to expect from this release:

  • Personalized Dashboards, simplifying and configuring the experience for all users from Partners and and team members spanning finance, investment professionals, portfolio operations and investor relations.
  • Advanced Performance Analytics, bringing even more power to Cobalt’s in-platform analytics such as track record and attribution analysis, cash flow modeling, and easily creating LP reports.
  • Actionable Insights, enabling users to create powerful analyses by comparing specific investment performance with operating metrics and KPIs.
  • Streamlined Data Collection, providing close user control on Portfolio Company communication while further lightening collection workflow lift.
  • Flexible Data Model to track cash flows and investment performance at the transaction level including tracking of cross-over investments, round-level performance, and consolidated investor reporting. 
  • Enhanced Permissions and Controls, delivering more support to account owners and user management capabilities.

The latest version is now available. Reach out to our team to schedule a customized demonstration and see how the latest version of Cobalt’s platform can work for you.


blog

Cobalt Chart of the Month: April 2021

April 1, 2021

Resource of a Different Color: Trends and Differences Among Private Market Styles in 2020

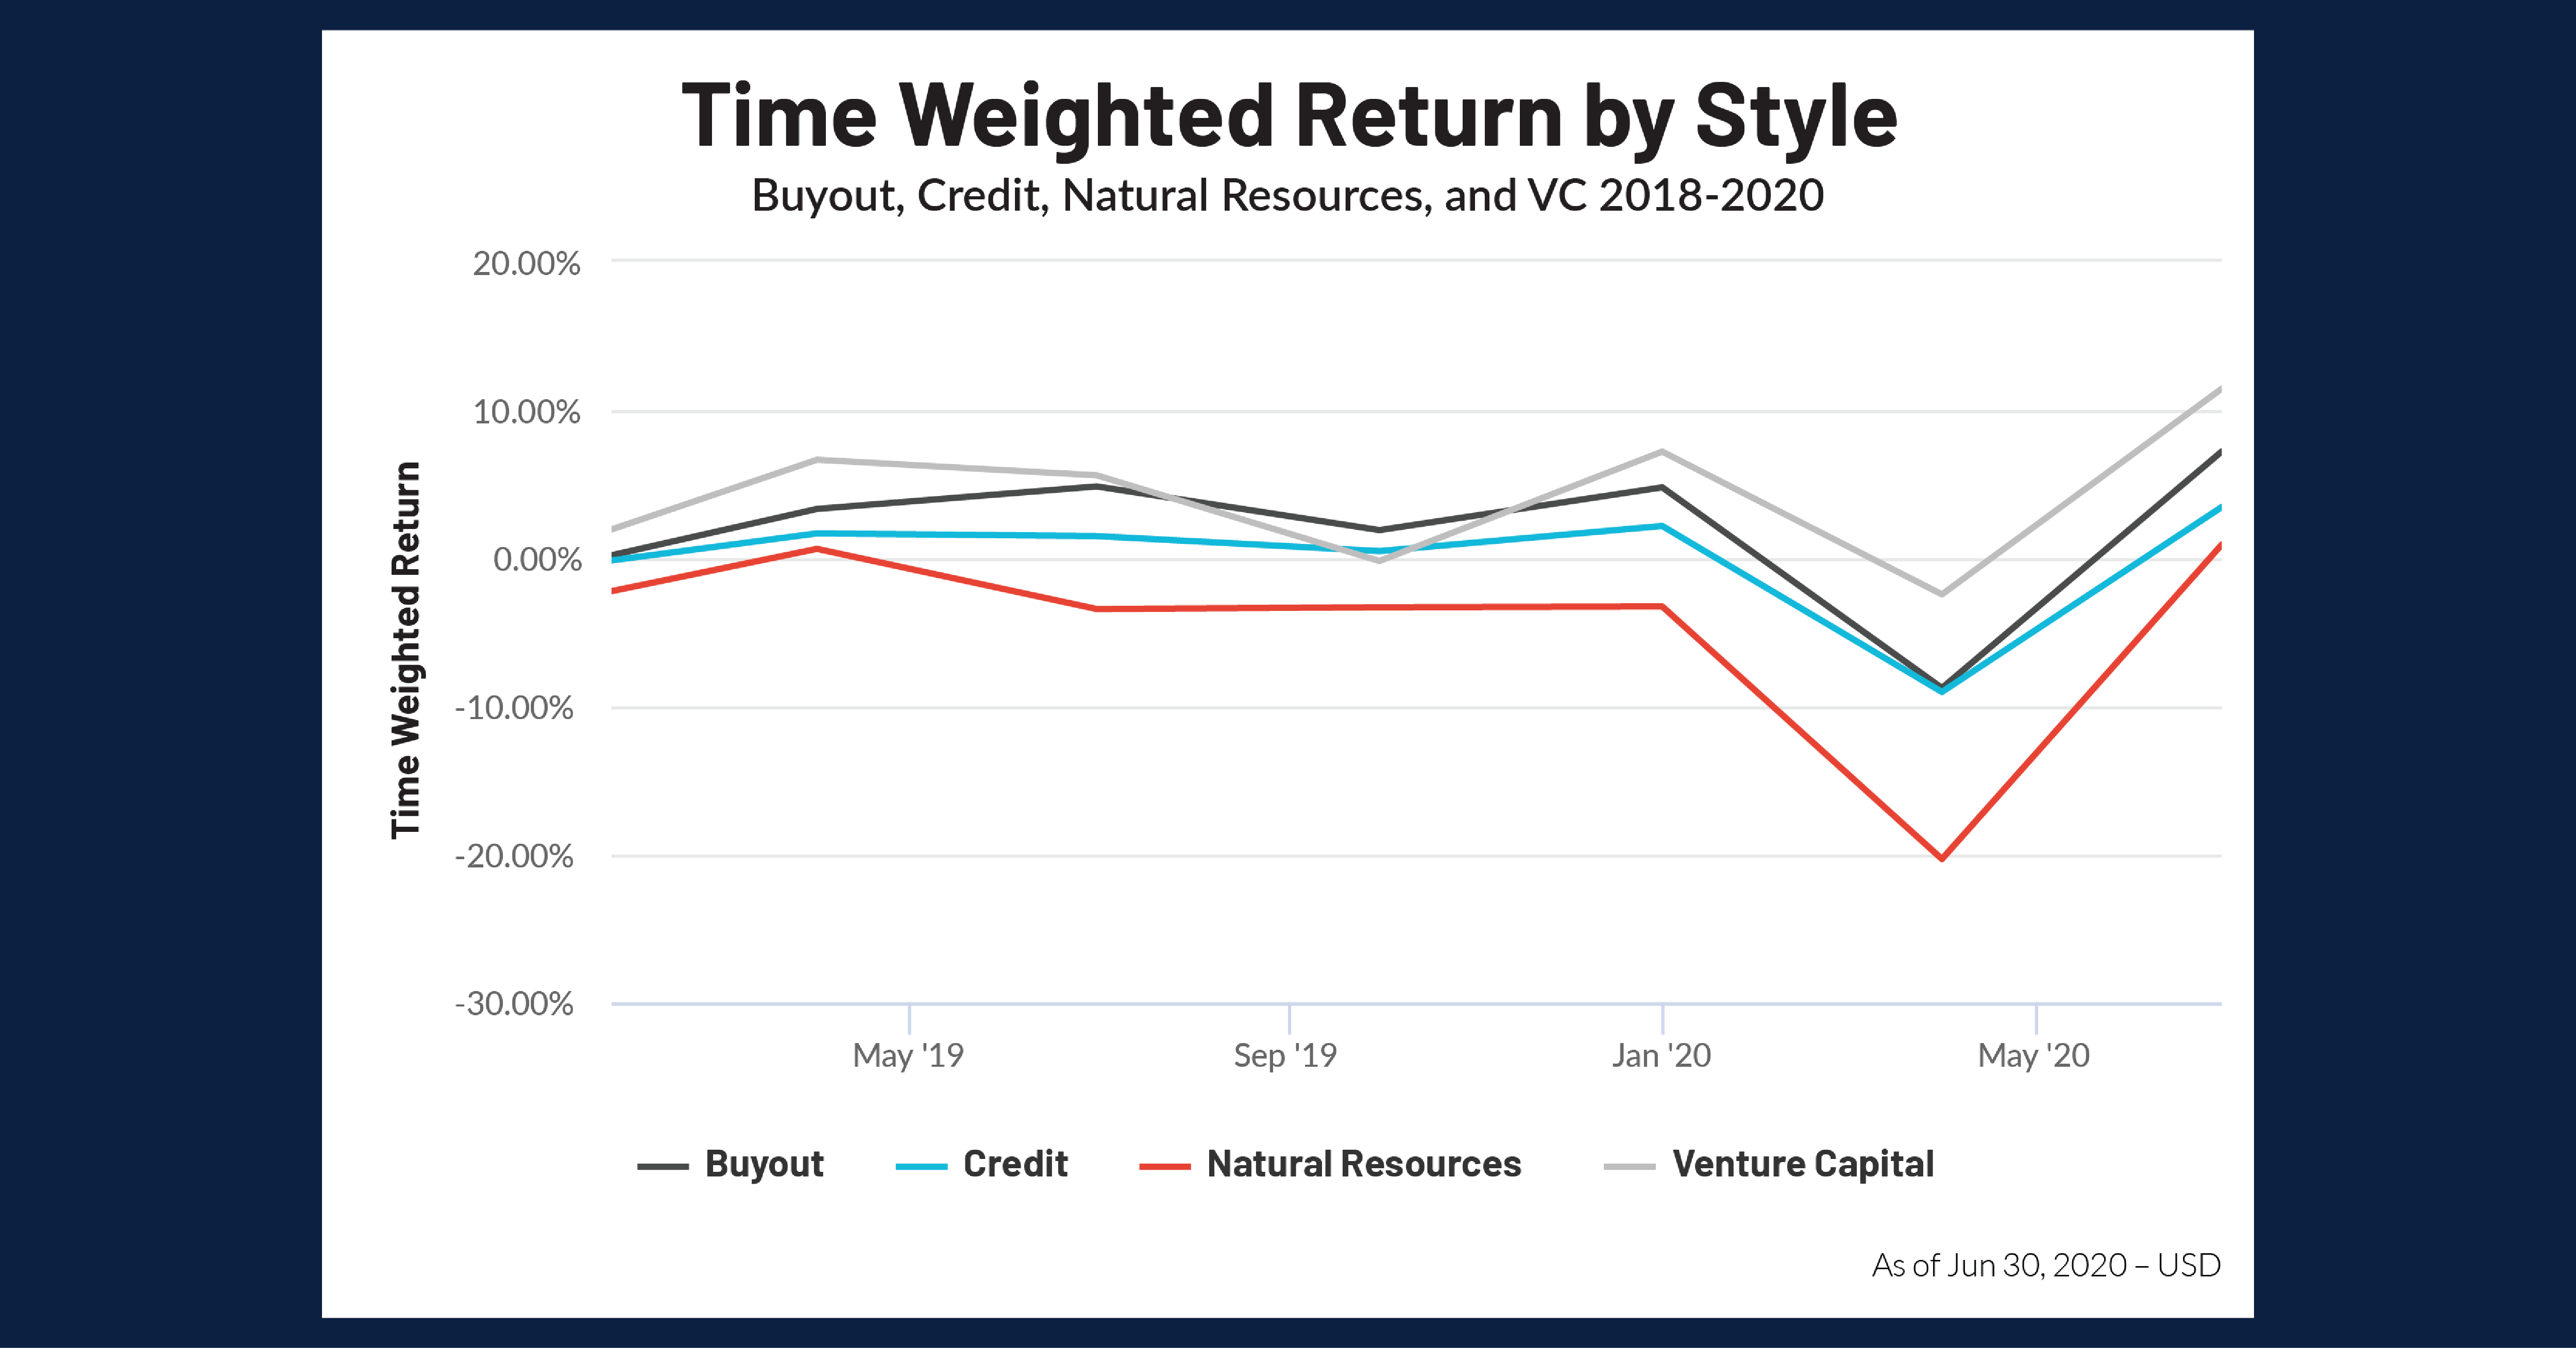
With the end of Q1 marking the one-year anniversary of the bottom of the drop across all markets due to COVID-19, we used Cobalt Market Data to look at the performance of the private markets in the lead up to Q1 2020 and the following bounce-back quarter. For this analysis, we’re looking at the time-weighted rate of return by investment style and have selected four styles to be indicative of the market in general: buyout, credit, natural resources, and venture capital.

Key Takeaways:

  • All markets across private equity followed the public market trend, with all of the selected investment styles experiencing declines of at least 9% from Q4 2019 to Q1 2020. All returns went negative, as asset classes across the board were unable to avoid the shock of COVID-19.
  • In particular, natural resources saw the greatest impact, declining from -3.3% in Q4 2019 to -20.3% in Q1 2020. Natural Resources had underperformed the greater PE markets during the preceding year, and the chasm was accentuated in March of last year. This precipitous drop likely stems from the demand shock on energy and fuel as global travel grinded to a halt, punctuated by oil futures going negative a month later in April 2020.
  • Buyout, credit, and venture capital saw proportionate pullbacks, however these were moderate when compared with the exorbitant decline in natural resources. A likely explanation for this is that these three styles offer diversification among sectors which helped to somewhat soften the blow, while natural resources are largely tied to the energy sector and its performance.

Looking Ahead

  • The recovery in the private markets was swift, with each style above posting positive returns the following quarter. This is in line with the greater financial market recovery, even as the economy lagged throughout the rest of 2020.
  • It will be interesting to see if natural resources stay tethered to the performance of the energy markets. We have seen energy perform well in the public markets in the 1st quarter of 2021, while the tech-driven rally through 2020 began to slow. As the economy further re-opens, we’ll see how other natural resource sectors such as timber and mining fare as the economy works its way back to normalcy.
  • A sub-sector to watch within natural resources is the renewable energy space. Renewable energy and climate solutions have become a focal point of the new administration, and energy-focused ETFs experienced their highest investment levels in over a decade. It will be interesting to see what the impact of this trend is on the energy sector and the private funds focused on it are in the coming decade.
blog

The Private Equity Manager’s Complete Guide to ESG Investing

March 23, 2021

Products devoted to social impact investing are growing faster than ever, moving out of socially-minded and niche organizations and into the broader public and private sectors. In 2020 alone, net inflows to ESG focused mutual funds and ETFs in the United States increased tenfold and one-third of all assets managed in the United States for individuals and institutions employ strategies that take social or environmental factors into account.

Clearly, this is no longer a niche investment approach and begs the question: how do private capital firms integrate this strategy, satisfy investors, and increase returns?

At Cobalt, we’ve supported many firms along their path to incorporating ESG metric tracking into their investment process through best-practices and our powerful portfolio monitoring technology. 

And we can help you too. Read our latest e-book which outlines the steps and considerations your organization can take to begin implementing an ESG investment strategy, provide investors with transparent reporting, and still drive the returns you need.

Download the Complete Guide to ESG Investing today.

blog

Cobalt Chart of the Month: March 2021

March 4, 2021

Mind the Gap: A Decade of Emergence in the Emerging Markets

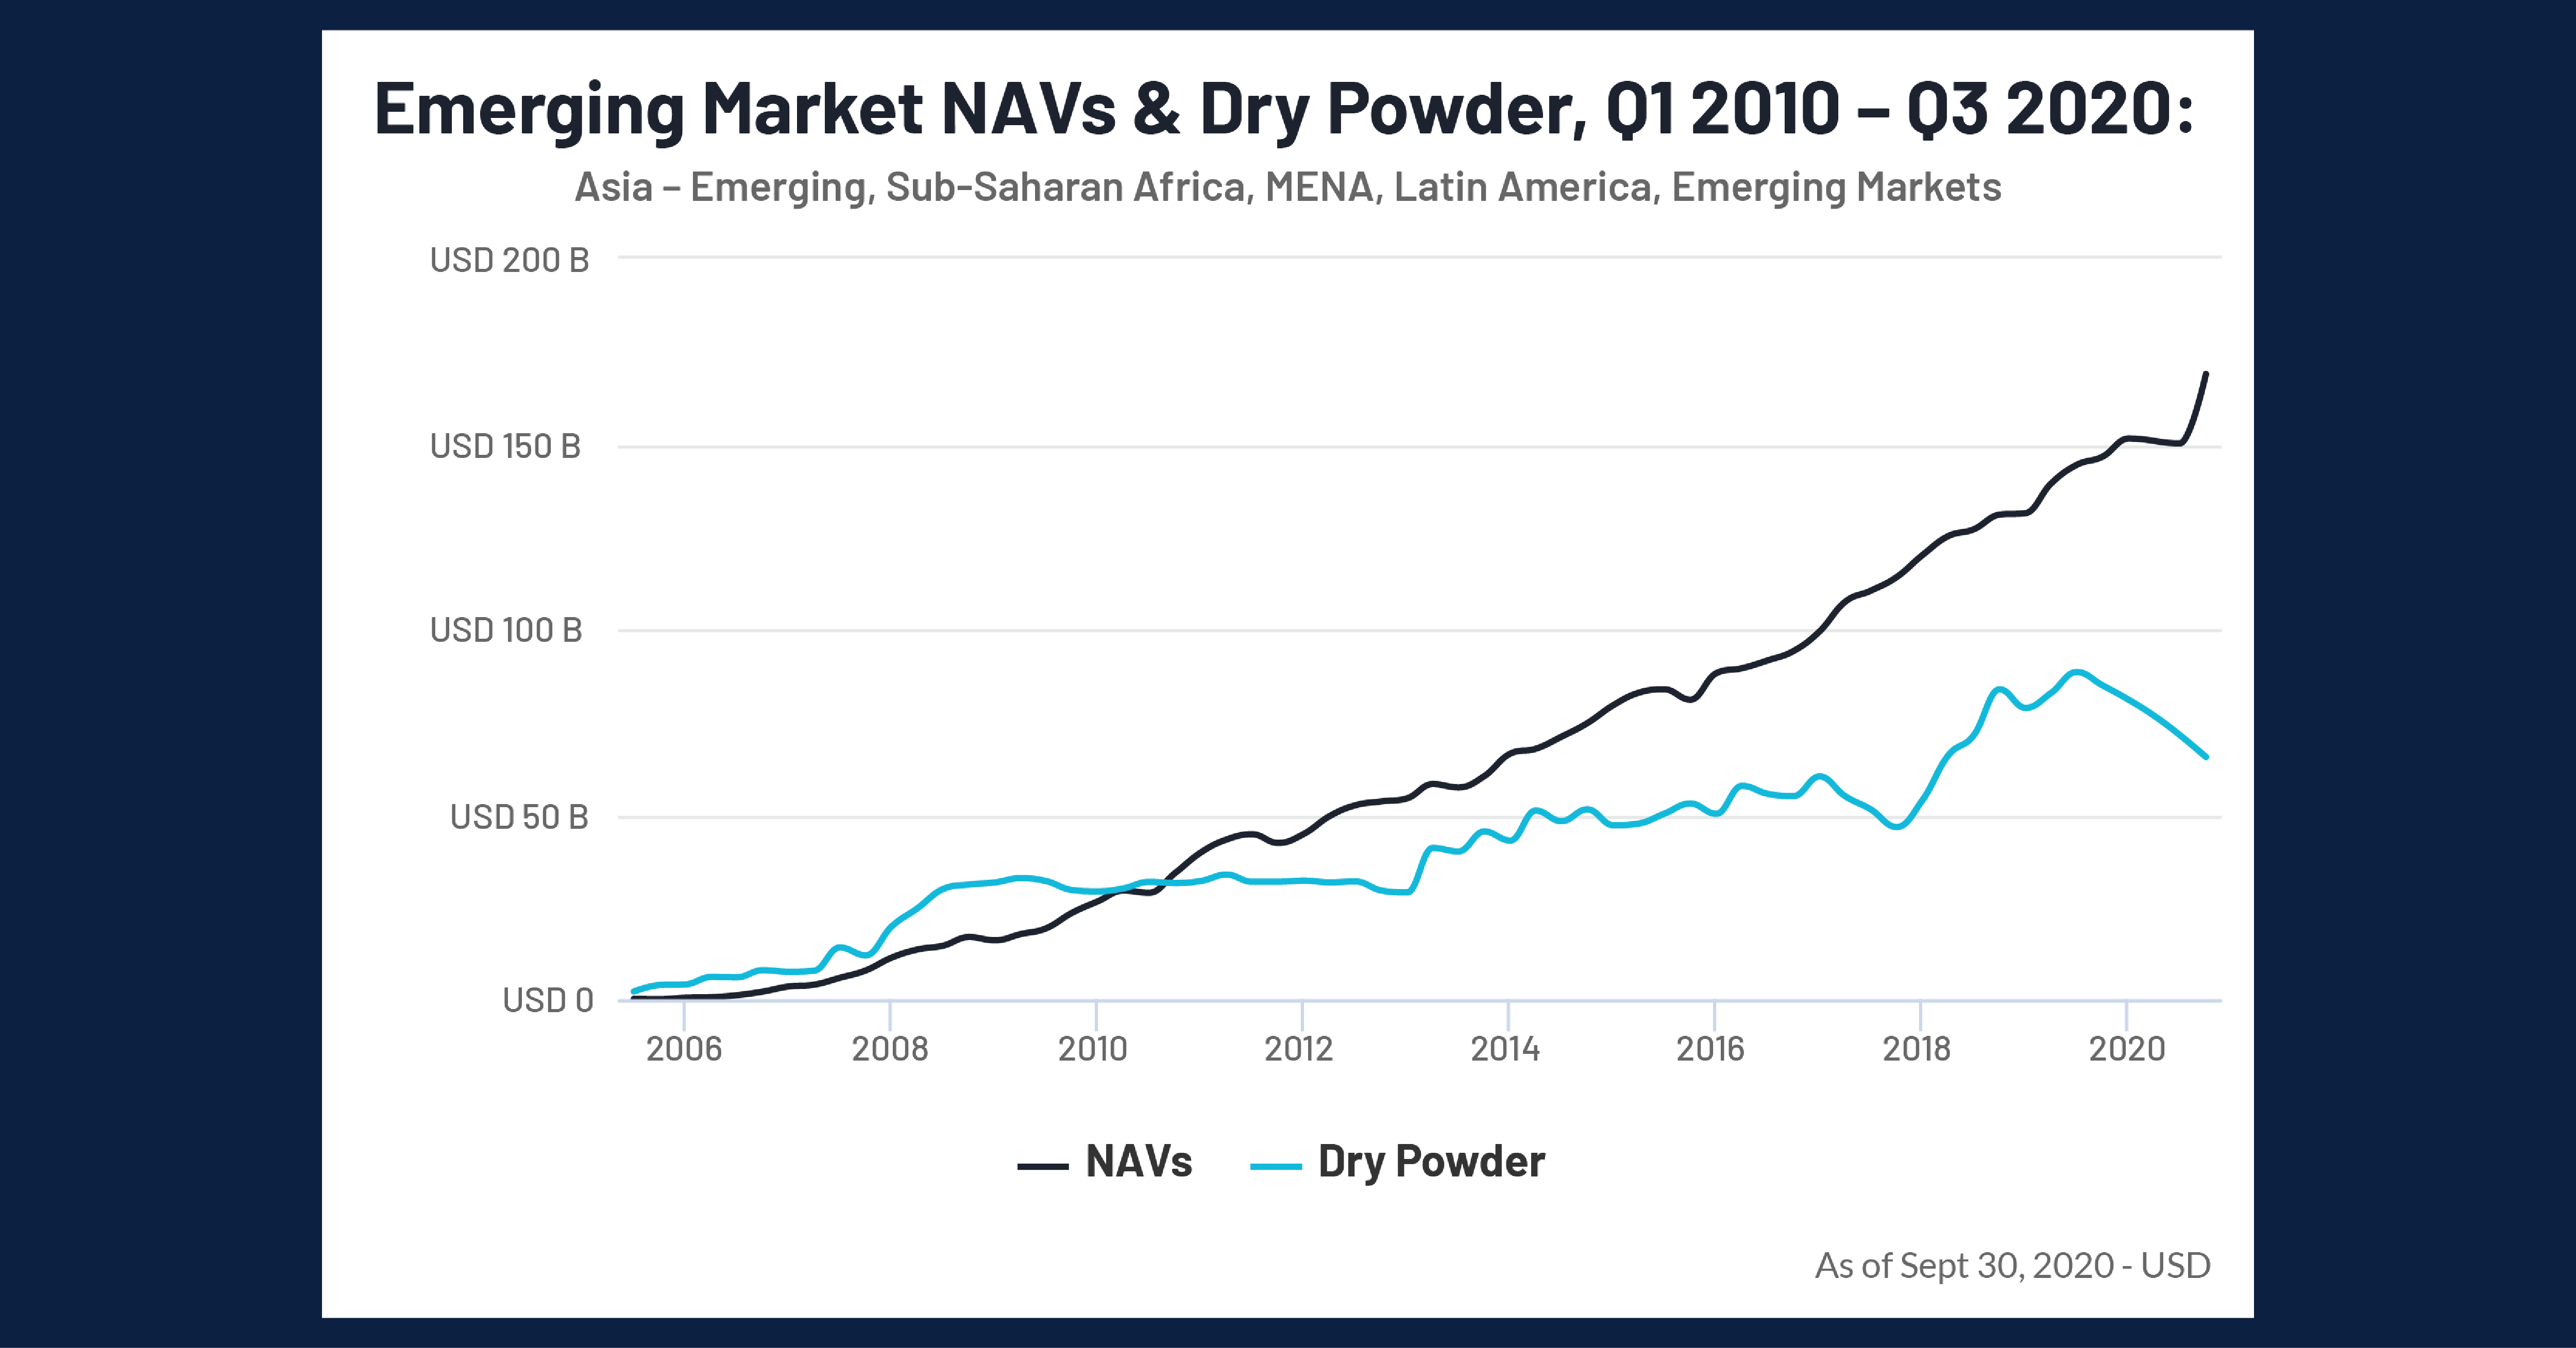
This month, we wanted to look at a perennially under-examined sector (the emerging markets) to see how investors have behaved in the calms and crises of recent memory.  As such, we used Cobalt Market Data to examine the relationship between Net Asset Value and Dry Powder in Emerging Market funds from 2010 to 2020.

Key Takeaways:

  • Since 2009, emerging market funding has increased from about $5 billion to a peak of approximately $85 billion in 2019. This 11-year increase is attributable to expanding private equity investment opportunities and a less saturated deal sourcing environment than in the North American and European developed markets.
  • The influx of funding from 2007 to 2009 led to a substantial increase in fund values leading into Q3 of 2010, where the returns of emerging market funds surpassed the dry powder in the market, a lead that it has not relinquished since. This trend of higher NAV’s in relation to dry powder funding parallels the overall private equity market.
  • The NAV of these emerging market funds exceeded the dry powder funding by a little under 20 billion in 2017, and by Q3 of 2020 it has increased to almost an $100 billion gap, attributable to a strong emerging market investment landscape in 2016 and 2017. This gap was further exacerbated by the 2020 pandemic drawdowns, leading to significant dry powder usage on the newly cheaper assets.

Looking Ahead

  • Though a pullback may be expected for these funds due to the latest recession, Emerging Asian countries like Malaysia are becoming increasingly efficient exporters. Additionally, the migration of insurance companies and other financial institutions to these developing economies (as well as a weak US dollar spurring easier loan payments from emerging market countries with dollar-denominated debt) will bolster the rapid economic expansion of these nations.
  • In the event of a short-term pullback, we could expect fund NAVs to decrease to reflect the economic recession experienced in 2020 by emerging economies. Funds invested in EM companies would feel the effect of disrupted supply chains, commodity exposure, and reduced domestic economic activity on their domestic demand and export capacity.
  • During the upcoming expansionary period, as investors seek growth opportunities for market-beating returns, we would expect dry powder for EM funds to increase. The gap between NAV and Dry Powder would likely decrease in the short term, but in the long run, as we see the MSCI Emerging markets index beat out the S&P 500 for the first time in 3 years, it is clear that public and private market confidence in high growth EM companies exists, and could easily recover once global economic uncertainty decreases.
blog

Best-in-Class Private Capital Platforms Integration

February 19, 2021

As the leading portfolio monitoring platform for private capital firms, we talk to private capital CFOs, Portfolio Operations leaders, and heads of Investor Relations at private equity and venture capital firms day in and day out.

One thing we hear consistently is: there’s a clear need for integration between the best-in-class solutions they use. Ideally they feel like they’re using a holistic suite of tools rather than siloed tech platforms that don’t work together. 

Historically, Cobalt has partnered with DealCloud to ensure our solutions are compatible and today it|venture’s Connect Platform technology is a game changer, providing amazing integration for our clients and prospects. 

In our latest webinar we talk to Emmanuel Mesa, Client Solutions Architect at DealCloud and Rob Cartledge, Manager at it|venture about exactly this conundrum and how we’re all working together to solve for it. 

Watch the webinar now and learn more about how we at Cobalt are tackling this issue for our clients. 


blog

Cobalt Chart of the Month: February 2021

February 4, 2021

Cobalt Market Data / Chart of the Month

After looking at the performance of follow-on investments back in October, we wanted to examine how some of those follow-on funds have behaved since the last recession to gauge how they may respond to the tumult of 2020.

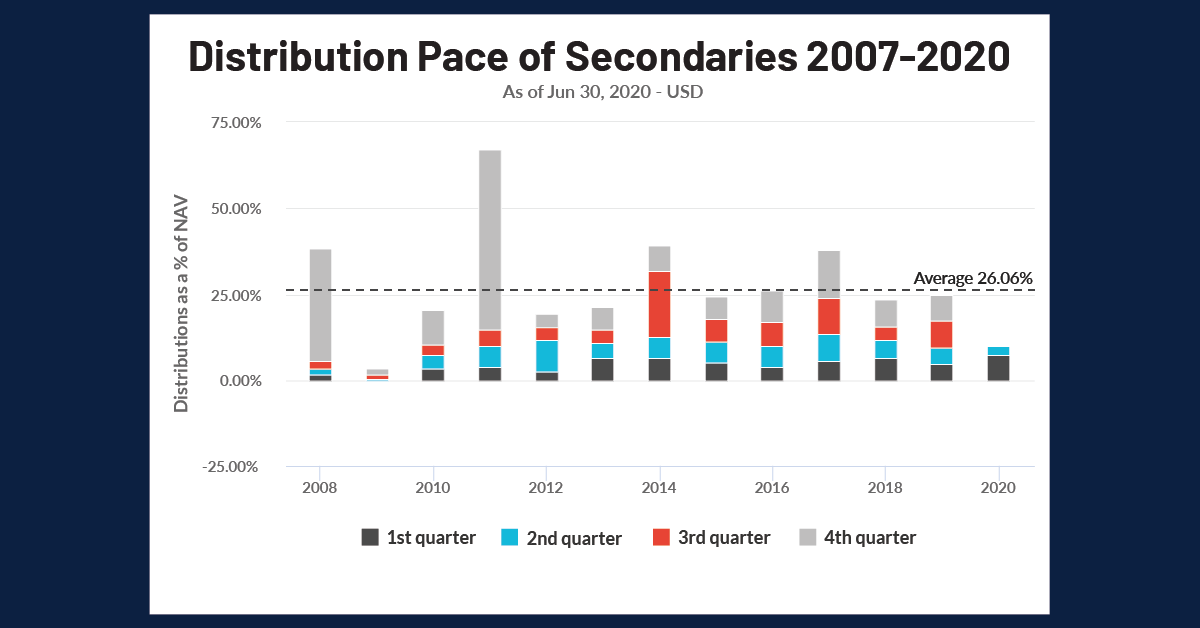
In our examination below we looked at all secondary funds since 2007 and broke it down by percent of the NAV that was paid out each quarter.

Cyclicality in the Secondaries Distributions

Key Takeaways:

  • More than most styles, secondaries follow a cyclical pattern of distributions. Starting in 2008, distribution pace peaked and then hit a trough the next year before building to another peak within two years. This cycle has been the dominant trend since the financial crisis, which could be due to a large number of successful funds in 2007-2008 leading to above average distributions 3-4 years later, coinciding with the next fundraise of those fund families, creating some vintage concentration.
  • In the past two years, we have seen a cessation of this trend as the pace has been constant since the 2017 peak and the overall oscillation has been dampening. This is likely due to both the lack of distributions for funds in the last three years (as they have not necessarily matured), as well as the fund concentration and abnormal performance factors diminishing over time as new funds enter the market.

Looking Ahead

  • As 2020 has created drastic shifts in demand and revenue, historical funds will see much higher volatility in their NAVs. For those firms gaining business during the pandemic. this could cause a spike in distribution pace. For those hit hard, value conservation could produce a sharp drop in distributions. Despite the uncertainty these demand forces have brought, the distribution rate for 2020 is roughly on pace with the past 2 years through June 30th.
  • Since this cyclical regime of the 2010’s coincided with a recession, it could be that the depressed prices seen in last year will create a similar profitable fund concentration and thus another distribution spike in 2023-2024.
blog

Cobalt Chart of the Month: January 2021

January 8, 2021

Cobalt Market Data / Chart of the Month

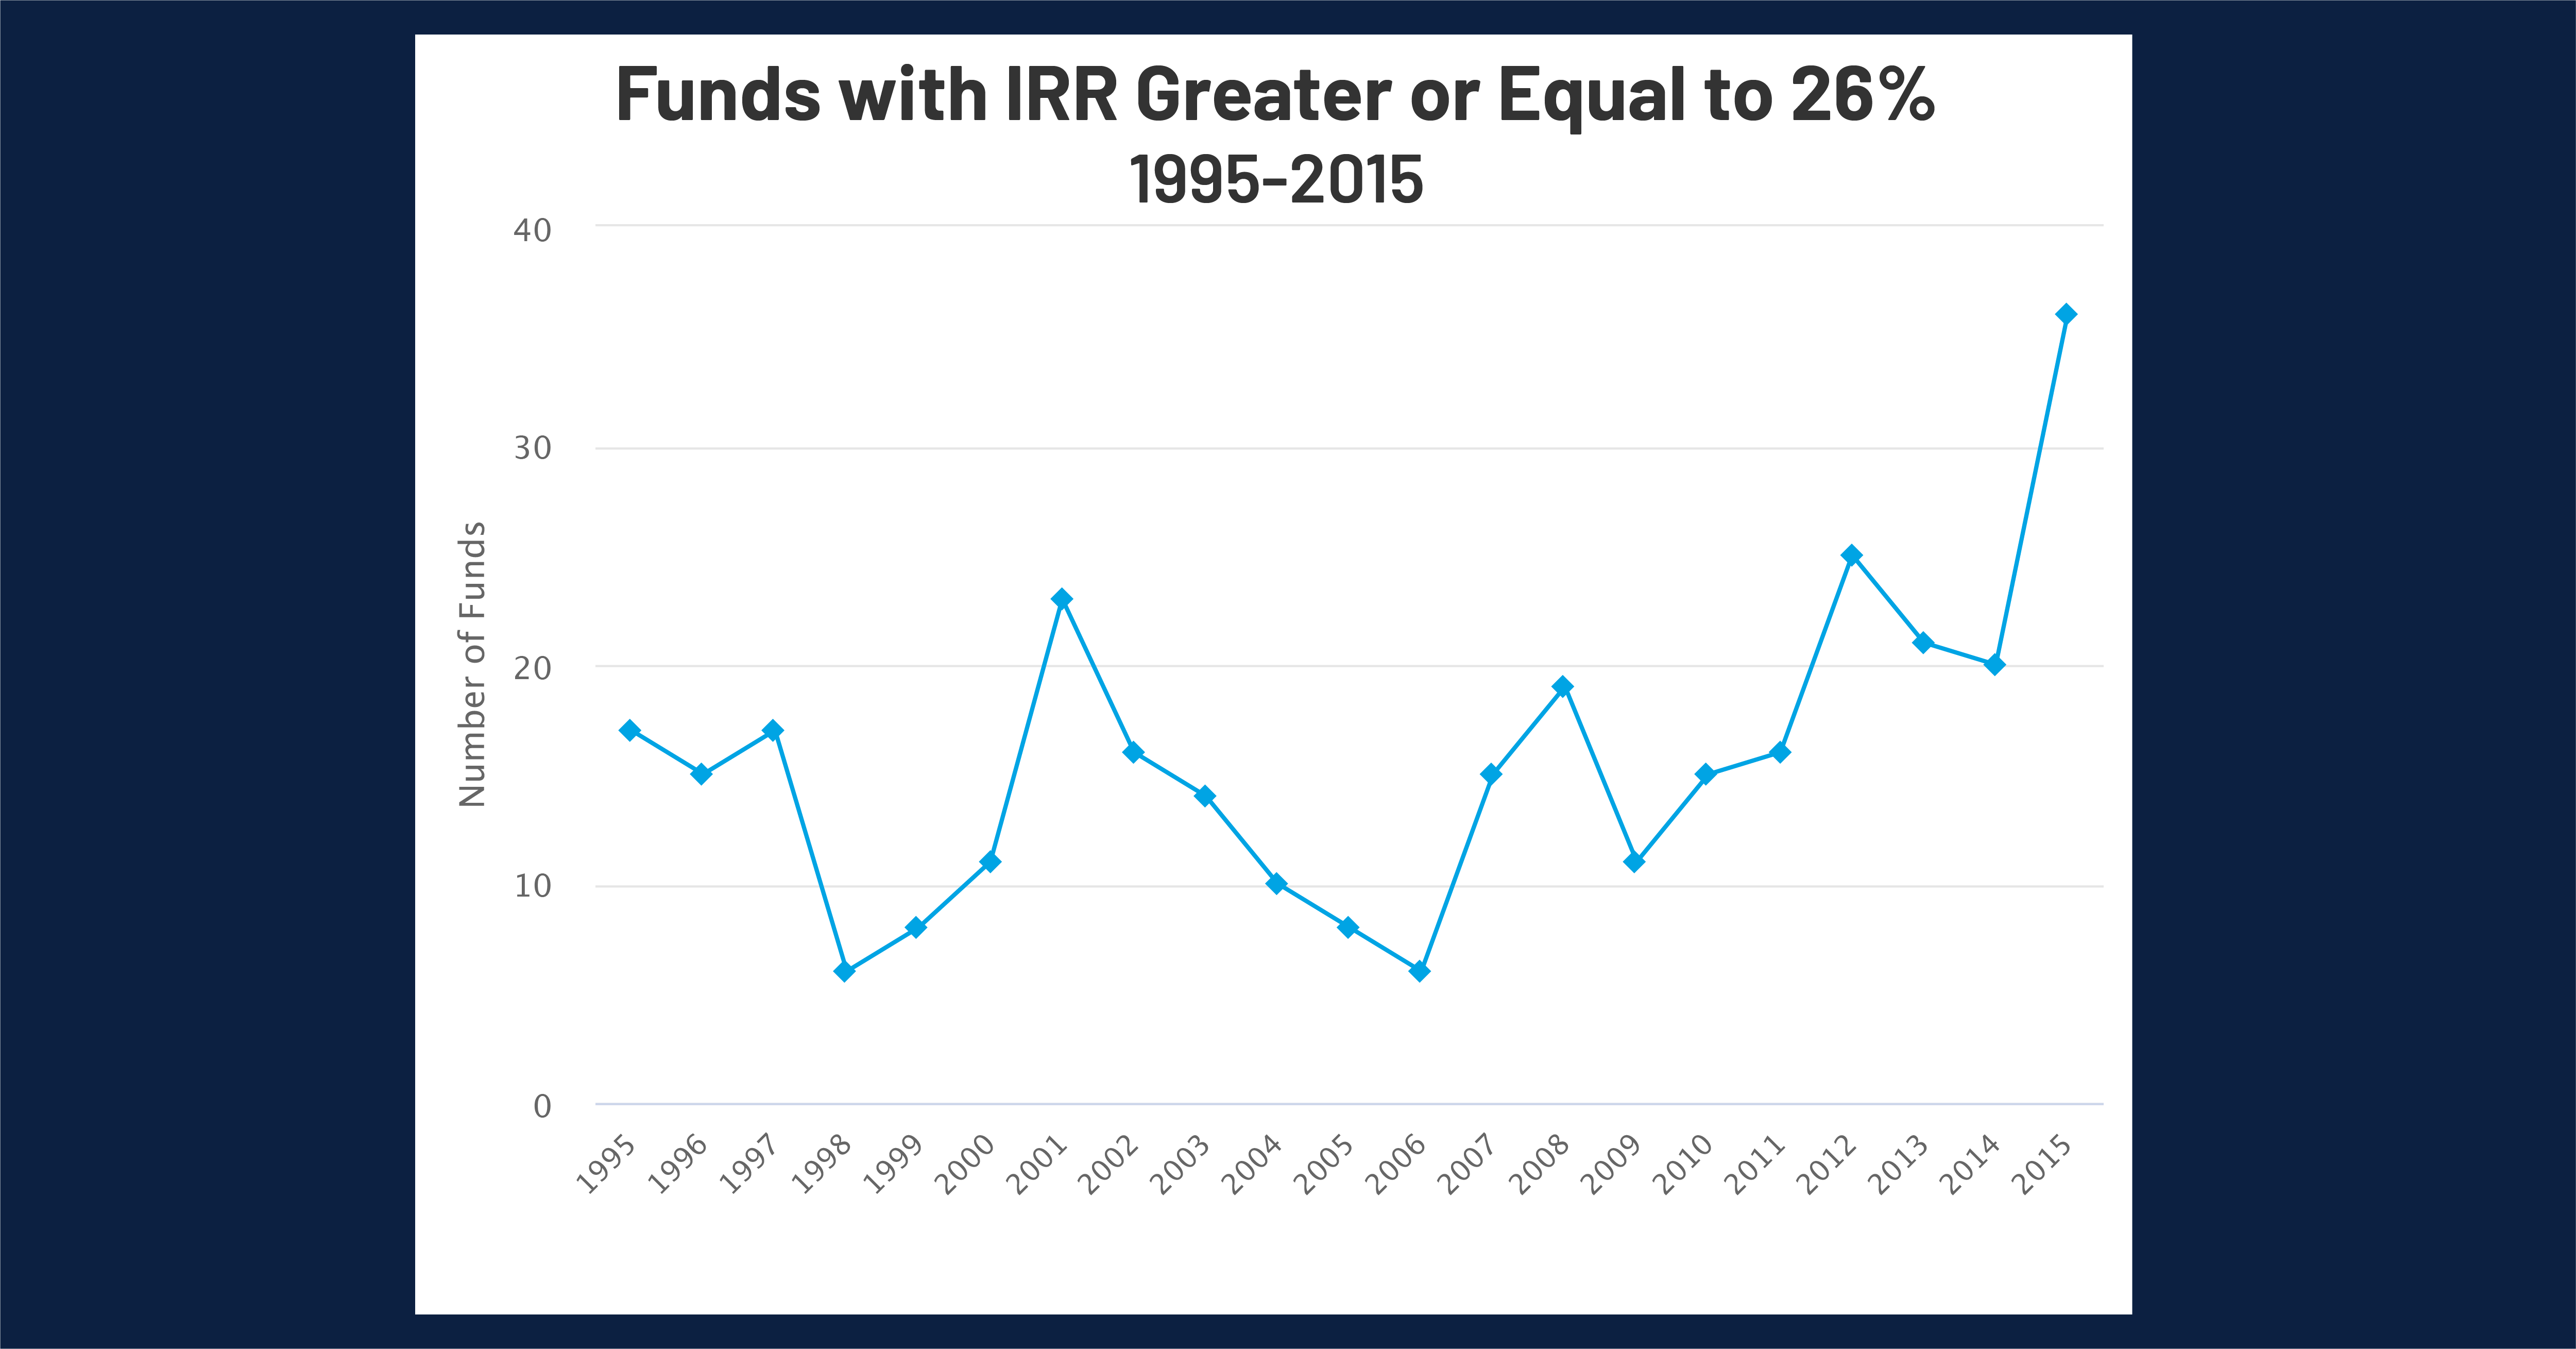
2020 is in the books and closes one of the crazier years for the global financial markets in recent history. We saw eye-popping returns in many different asset classes throughout the post-March rally. The start of the new year means time for New Year’s Resolutions, and for private equity funds that means generating superior returns. In that spirit, we wanted to understand the trends of superior-performing funds in private equity in the past to see how the number of funds with exceptional IRRs has grown over time.

In our analysis, we will be working with the Cobalt dataset from 1995-2015, including all funds with performance greater than 26%, as seen in the chart below. The past 5 vintage years have been excluded from the analysis due to high-variance IRRs early in a fund’s cycle.

New Year’s Resolutions:
Trends in the Top-Performing Private Equity Funds

Key Takeaways:

  • Early in the analysis, we see a more cyclical pattern of top-performing funds, with a steady increase through the late 90’s, followed by 5 consecutive years of decline in the 2000’s. This decline roughly tracks with the dot-com bubble in the public markets, leading to a collapse in demand and decline in top level performers throughout the next 5 years.
  • Post-2009, we see a steadier trend of year-over-year increases. While the 2015 surge may regress as funds mature, and may still mark a new all-time high for funds meeting this threshold, It seems likely the upward trend will continue into the latter half of the 2010’s. Moreover, the healthy economy experienced in the latter half of the decade created a good environment for these numbers to sustain, as seen in previous cycles.
  • As the bar for top performers continues to rise, there will be a greater level of competition in the market to reach these thresholds, benefitting firms and investors alike; A larger pool of funds presumably means more firms performing well and more institutional investors reaping the benefits of this performance. We have also seen the drive for superior returns reach new heights once again resulting in trends such as the IPO and SPAC frenzy, as well as continued redoubling towards traditional private equity. This leaves investors with a diversity of avenues to achieve returns, and promising firms able to achieve the best investment terms as GPs compete to fund them.

Looking Ahead

  • Private Equity has long been seen as a way to create superior returns in a portfolio, and we’ve seen a growing number of funds join the elite class this past decade.
  • The changes that 2020 brought to the financial landscape will be an interesting test to this growing trend, and we’ll be looking for what these implications have for the upper end of the private markets.
blog

Cobalt Chart of the Month: December 2020

December 16, 2020

Cobalt Market Data / Chart of the Month

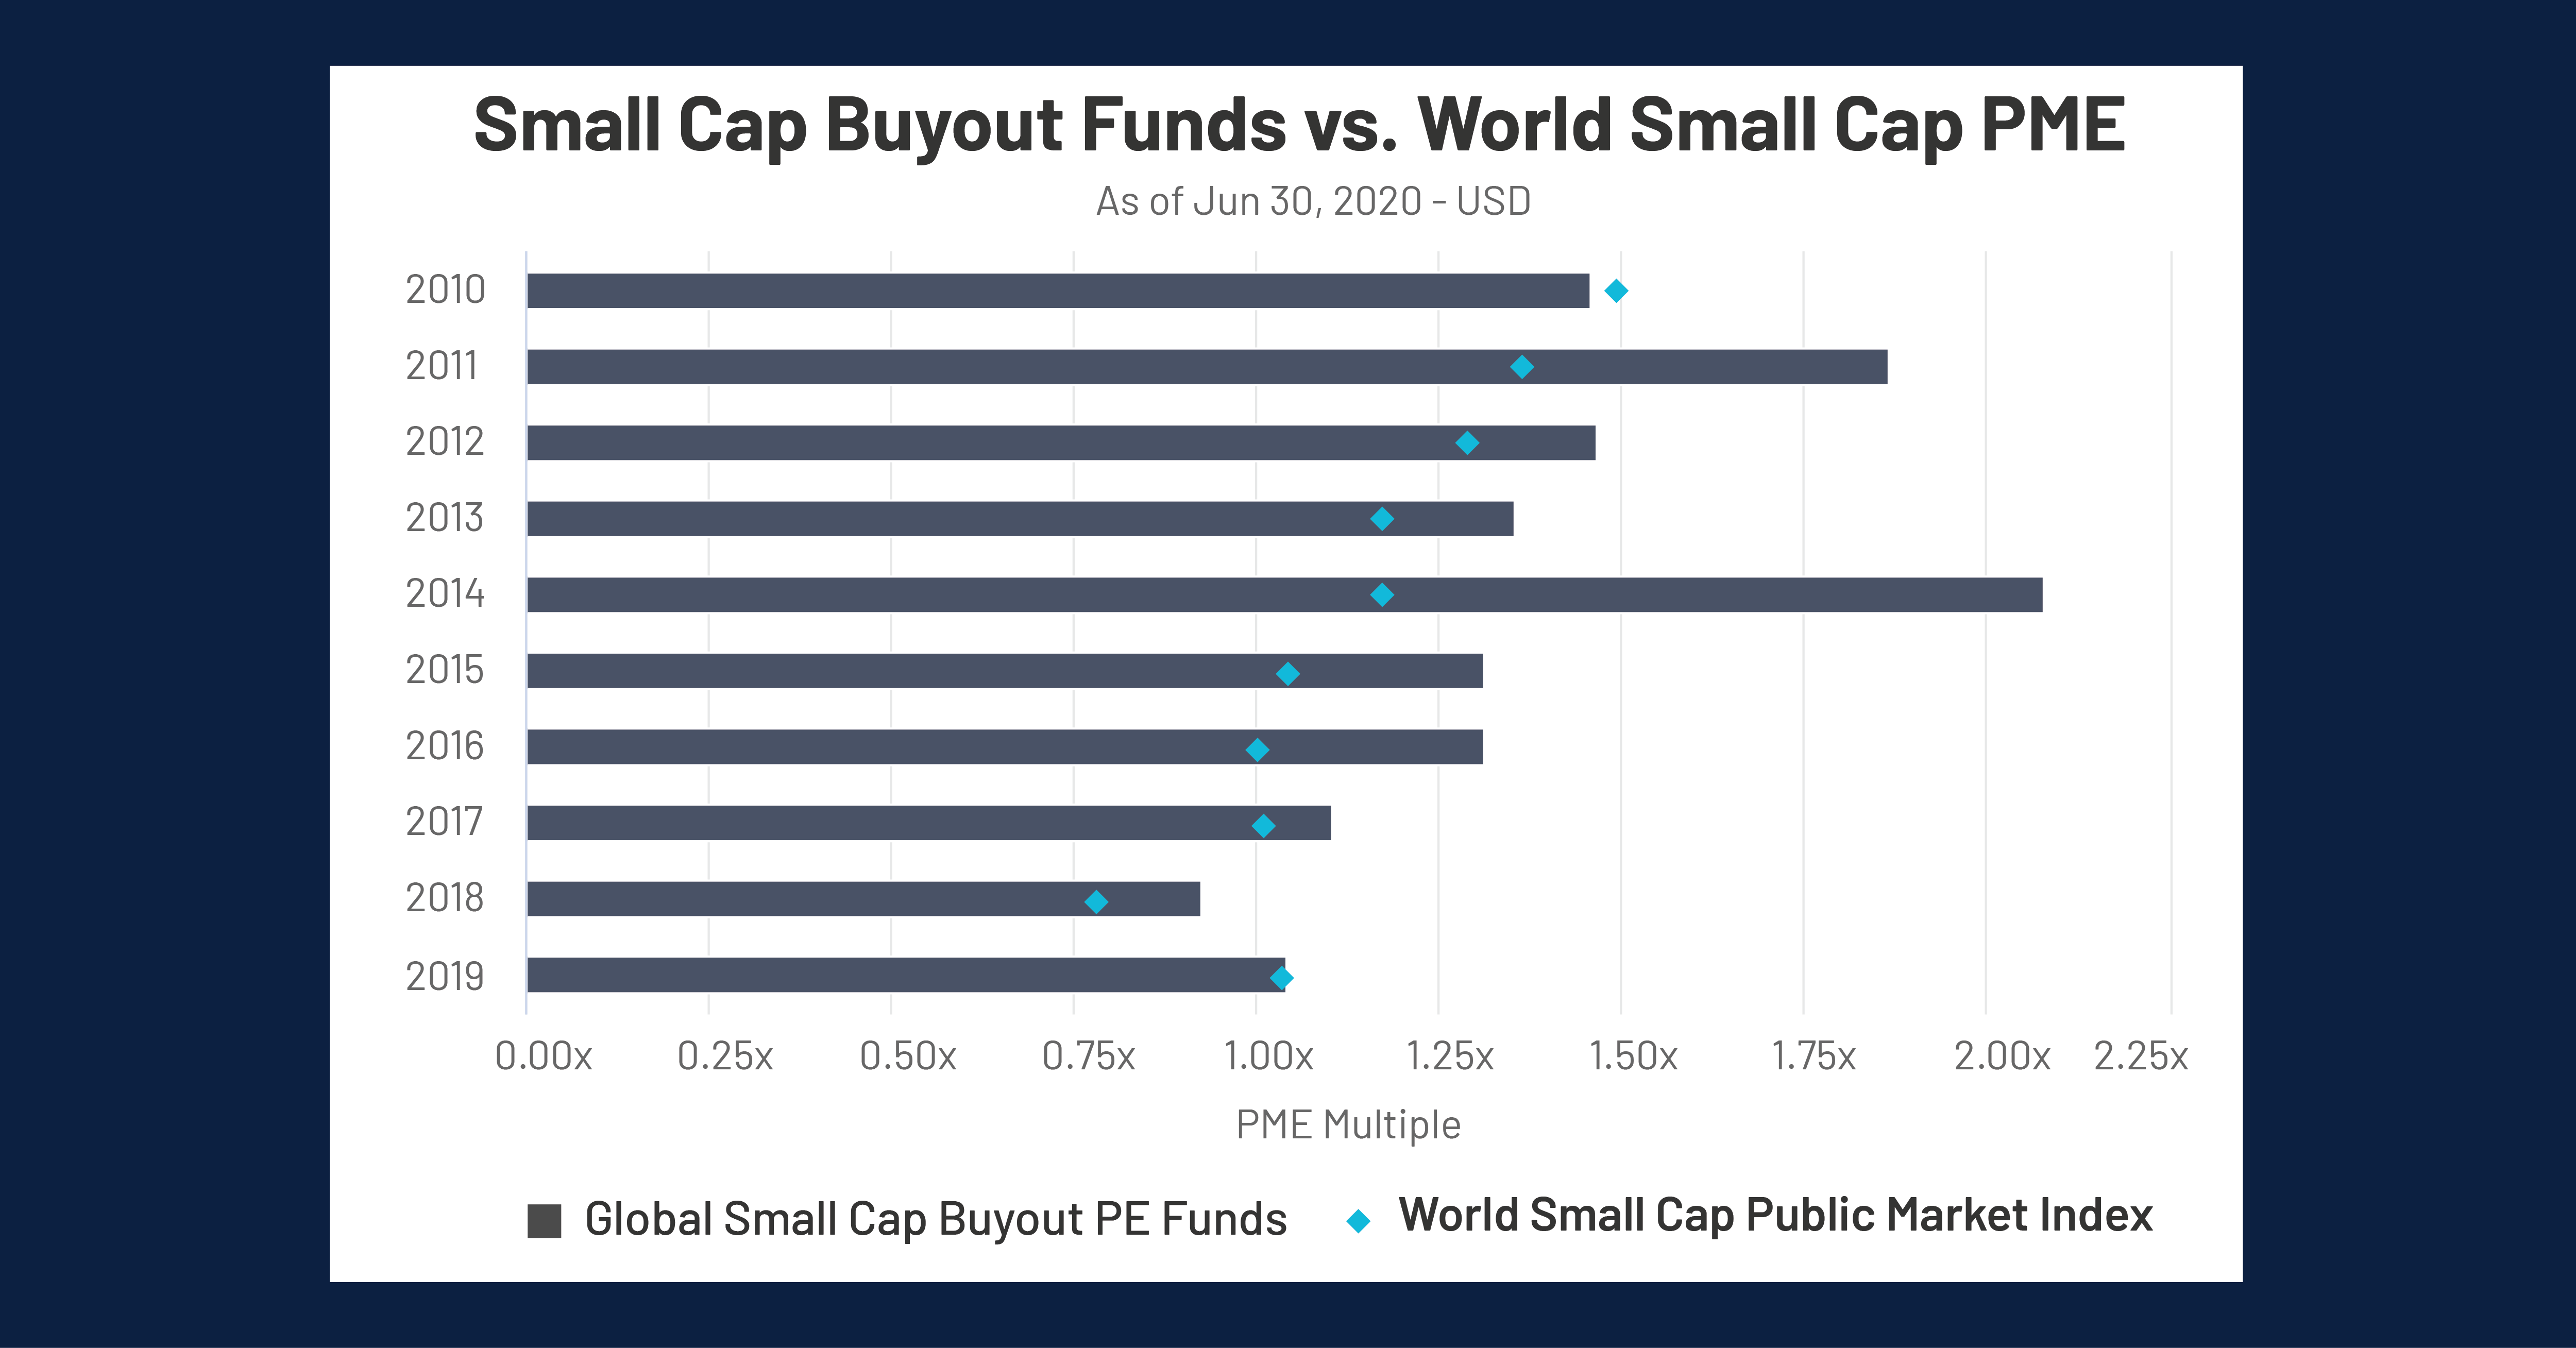
With 2020 coming to a close, we looked at one of the fastest growing investment trends – Special Purpose Acquisition Companies (SPACs) – and its relation to private equity. To do this we analyzed Small Cap Buyout performance, the buyout sector most likely to be on the same playing field as SPACs. The graph below displays the industry average TVPI of Small Cap Buyout Funds from 2010-2019 versus the World Small Cap Public Market Index, and comparing each using PME analysis.

2020 IN REVIEW: SPACS AND SMALL CAP BUYOUT FUNDS


Key Takeaways:

  • Small Cap Buyout funds consistently beat the returns of the World Small Cap PME, maintaining a buffer of at least .05x since 2011 up until 2019. PE funds perform well during expansionary economic periods, and can capitalize on recessionary periods, allowing them to access opportunities that can outperform the market at large.
  • The PME returns have decreased by an average of .057x each year since 2010, jumping up almost .25x in 2019. Small cap buyout funds have followed the same trends with the exception of 2011 and 2014, which can be partly attributed to the record-breaking funding year of 2007.
  • The World Small Cap PME recovered substantially in 2019 from 2018, which was one of the worst years for the world market since 2008. The speedy recovery in 2019 follows the same trend from 2008 – 2009, when the post financial crisis year proved to be one of the strongest periods for economic growth. Because small cap buyout funds take longer to mature and post returns, it’s understandable that rapid economic growth would bolster the public sector before the private market posts the same level of return.

Looking Ahead

  • Private Equity firms may witness increasing competition from SPACs in the coming years as their popularity rises with firms eager for an alternative that can offer a faster IPO process under an experienced manager. SPACs also often allow a higher degree of management autonomy in comparison to a buyout firm’s hands-on managing approach, which is more likely to result in a sale rather than a public offering.
  • According to Axios, SPACs have raised about $24 billion in 2020, commandeering capital from an average IPO size of about $380 million. Small cap buyout firms have raised approximately $10 billion in funding throughout 2020 with an average fund size of $400-450 million, insinuating that small cap buyout funds and SPACs operate in the same playing field.
  • While investors may feel safer with a long-standing small cap buyout firm, larger PE firms such as Altimeter and Oaktree are also sponsoring these blank check organizations. SPACs backed by private equity giants may pose a serious threat to lesser-known small cap buyout firms.
  • On the other hand, small cap PE firms may have an incentive to work with SPACs, as the economics of a sale to a SPAC can be very advantageous, such that these buyout funds can potentially sell a portfolio company to a SPAC for a 15% premium of the share price compared to an average sale.

Considerations

  • Will the growth of blank check investment organizations undergo continuous growth post COVID, or will their popularity correlate more closely with recessionary periods and opportunistic acquisition environments?
  • As small cap funds are generally considered riskier than large cap funds, will the popularity of small cap funds and SPACs inversely correlate with economic prosperity? I.e., will expansionary periods favor small cap buyouts and recessionary periods SPACs?
blog

Preparing for 2021

December 15, 2020

Cobalt launches new website

2020 has been a big year for Cobalt: from major product enhancements to new critical partnerships, we’ve delivered on our commitment to bolstering our private capital GP clients’ experience on our platform. 

We work diligently to meet our clients, quite literally, where they are, so they can take their firms and portfolios where they want. The result is improved performance, excellent reporting, and top-tier business intelligence to propel private capital firms well into the future. 

As we head into 2021, a year that promises to hold even more good news from Cobalt, it was time for us to revisit our website. In a world where your online presence is often your first “port of call” for anyone you do business with, it was important that our own telegraphed the streamlined, intuitive experience our clients have on our platform. 

So, tying in with the logo we launched earlier this year, today we launched our brand new website. In a nutshell, it provides a clearer picture of what you can expect to find in the Cobalt platform, the company we keep among integration partners, and the type of ideas, reflections, and conversations we are having daily across clients, partners and other industry leaders. 

We hope you like it. As always, if you have any feedback or questions, don’t hesitate to reach out to us directly.

blog

Cobalt Chart of the Month: November 2020

November 10, 2020

Cobalt Market Data / Chart of the Month

The Cobalt Research team recently pushed its Q1 2020 private equity benchmark to the Cobalt platform. With this dataset at our fingertips, we’re taking a look back at how the private markets fared during the economic turmoil of the first quarter this year.

In order to gauge how private equity performed in Q1, we analyzed a basket of funds (Cobalt Private Equity Index) comprised of Global and North America buyout, venture, and growth funds from 2005-2020, and compared it to the MSCI ACWI and Russell 3000® Index using the Cobalt PME methodology.

Q1 2020 Analysis: Looking back at PME trends from the past decade


Key Takeaways:

  • The public market indexes followed similar patterns over the observed period, experiencing sharp volatility from 2010-2012, and showing the same drawdown in Q1 2020.
  • PE not only outperformed the public markets consistently through the period but also saw less drastic downturns both at the beginning of the decade and earlier this year, with the IRR down in Q1 from 12.44% in Q4 2019. By comparison, the MSCI ACWI and Russell 3000® Indexes saw downturns of 2.62% and 2.08% respectively from the previous quarter.
  • Private equity’s lowered volatility, paired with its overall outperformance, made it a more attractive investment vehicle compared to the public markets in the 2010s, as a ‘higher floor, higher ceiling’ play. This continued to be the case in the early days of the COVID crisis, as private equity returns remained more consistent through the 1st quarter of the year.

Looking Ahead

  • Generally speaking, the long-term horizons of private equity make it less volatile compared to the public markets. In the past this has meant institutional investors have increased their interest in PE during economic downturns, seeing it as an effective diversification mechanism.
  • We will be looking over the next few quarters to see if the trends from previous recoveries hold true as the markets navigate COVID. If history does repeat, we should expect performance to be more steady among PE in the coming years, along with an uptick in commitments to private equity funds.