Chart of the Month: January 2022
New Year, New Trends: NAV vs. Dry Powder Over the Past Quarter Century
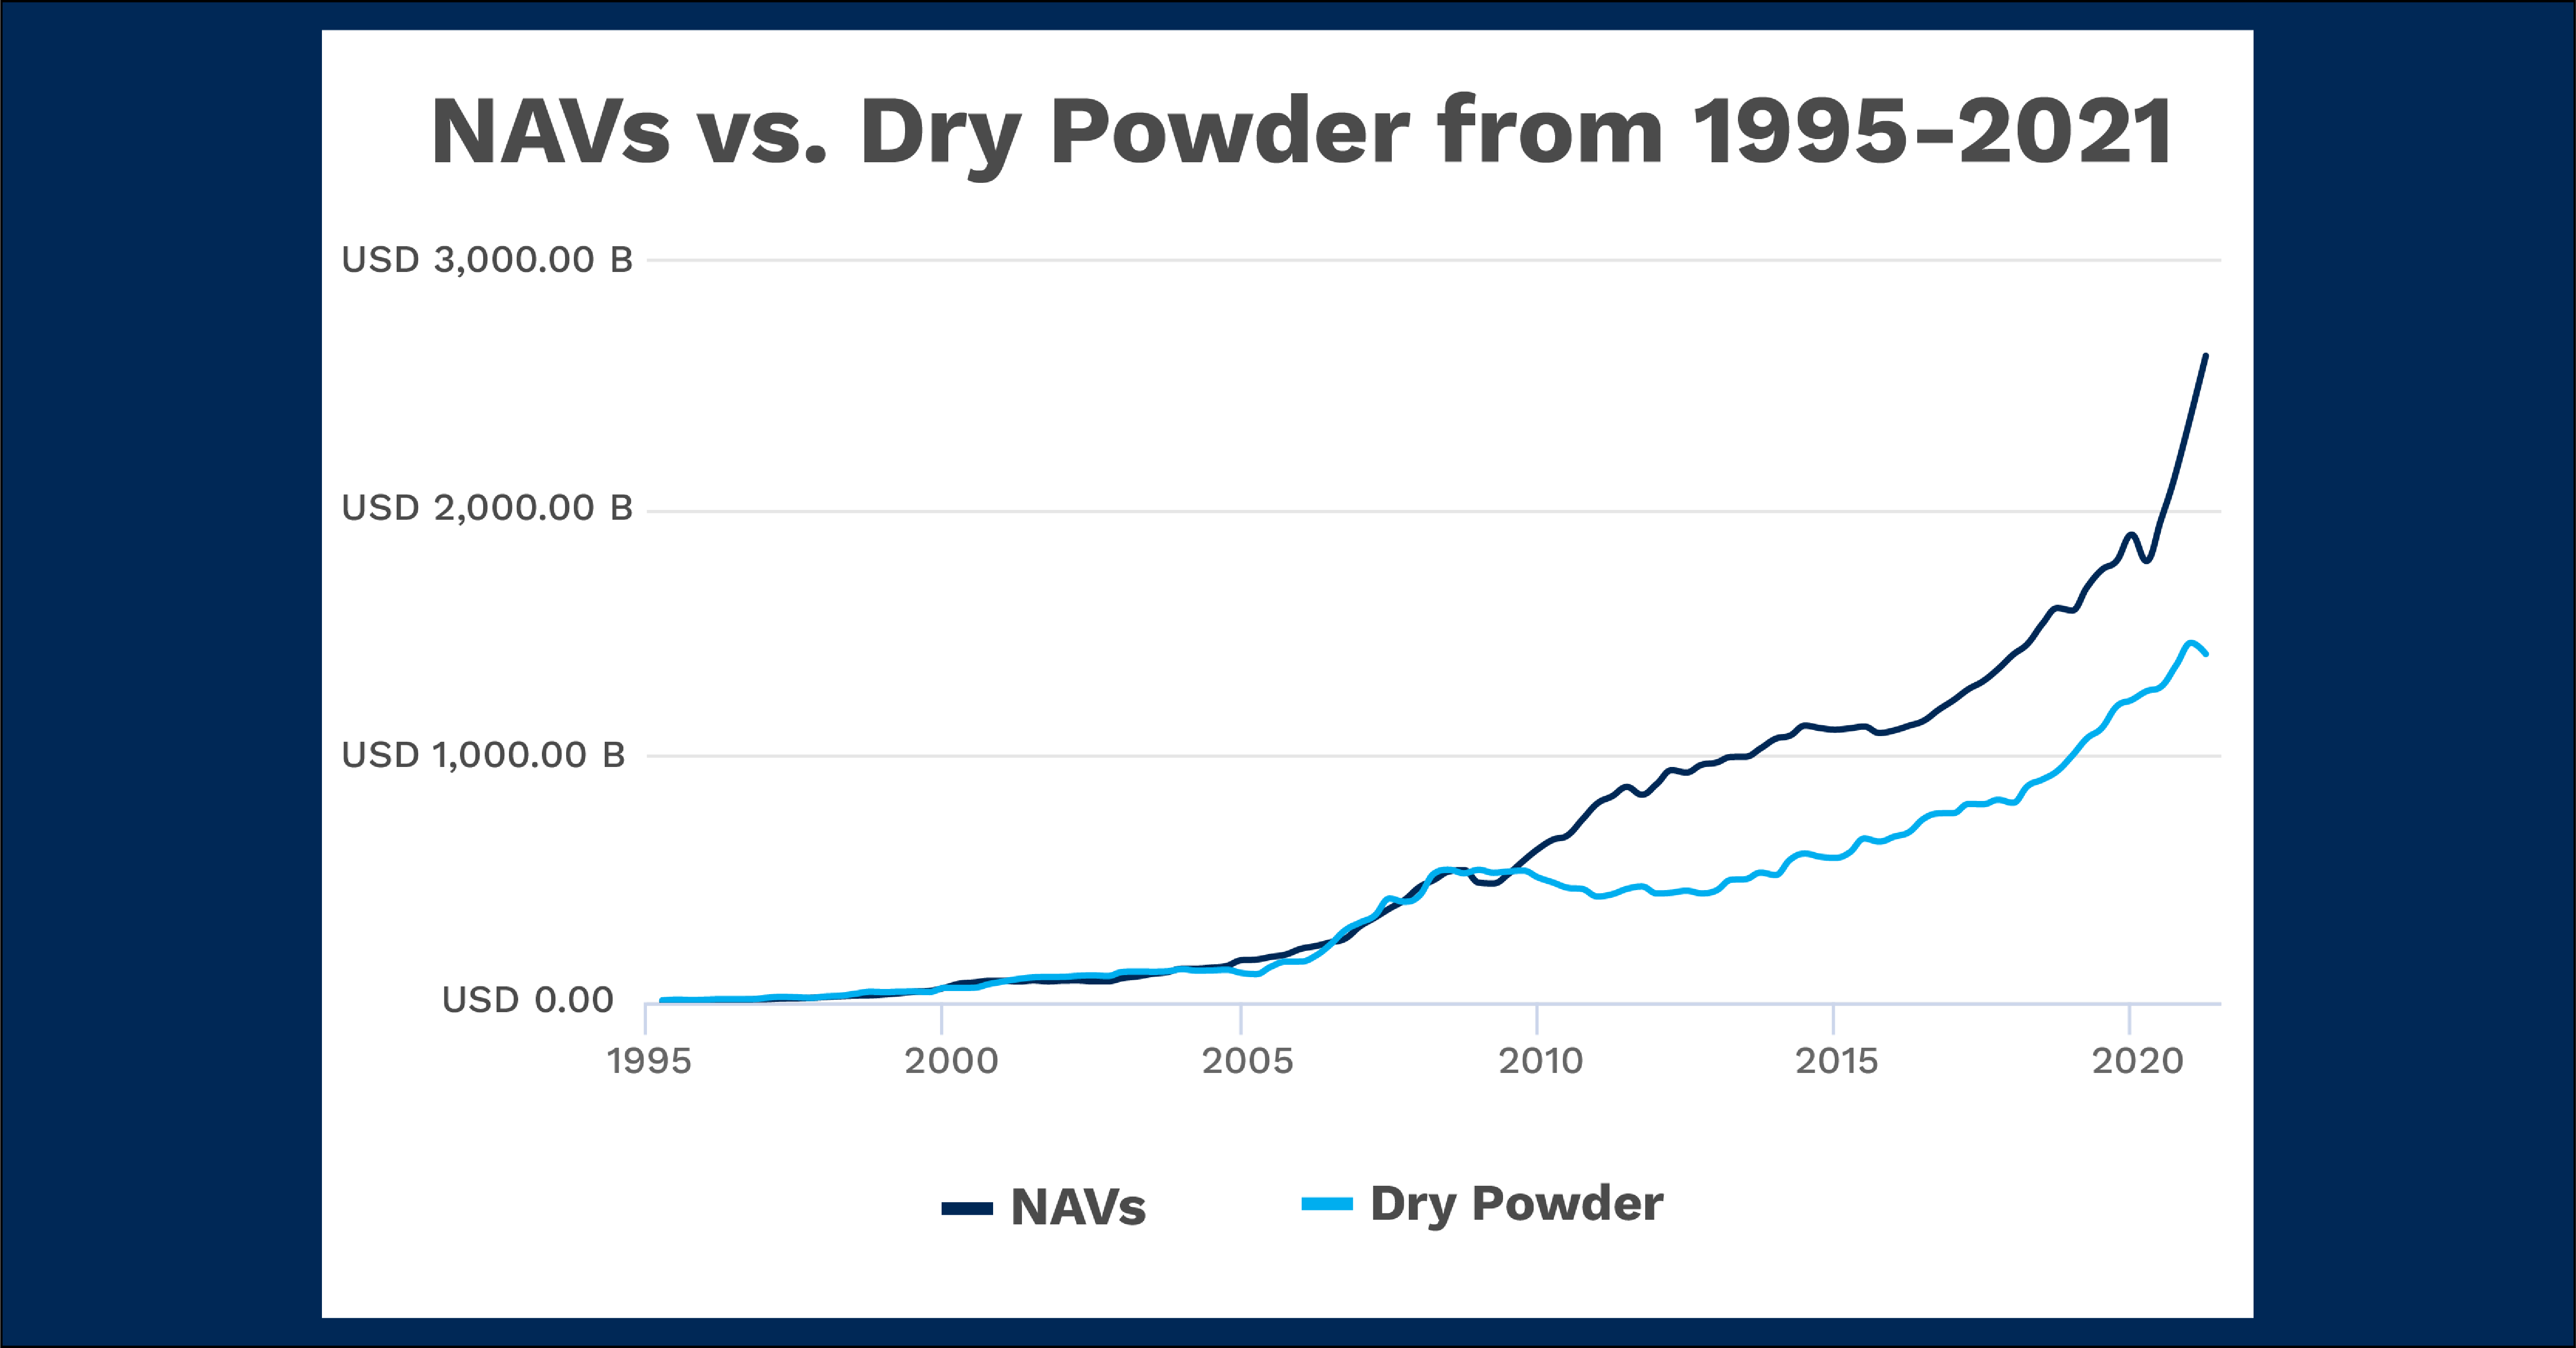
A New Year is the time for resolutions and change. With this mindset, we looked back at the private markets to see where momentum has changed and the trends that have formed over the past quarter century. Using Cobalt Market Data Analysis, we identified the relationship between NAV (net asset value) and dry powder and how it has changed over the years, dating back to 1995.

Key Takeaways:
- At the beginning of the pandemic in Q1 2020, NAVs started to diverge from the trend over the previous decade in which the pair rose at similar rates. NAVs now sit at roughly double the amount of dry powder in the market ($2.6T vs. $1.4T).
- While NAVs have grown at an accelerated rate, dry powder has stagnated over the past few quarters, even decreasing slightly from Q4 2020 to Q1 2021.
- The last divergence between NAVs and dry powder was seen after the last global financial crisis, from 2009 to 2011 when NAVs rose as dry powder decreased. This may have been caused by firms increasing their spending on distressed, undervalued assets in the wake of the recession, funded mostly by existing capital on hand. After this, the above-mentioned trendline was set, where both figures were rising at similar rates throughout the rest of the decade.
- One explanation for this latest emerging gap between NAVs and dry powder is that even Private Equity has not been immune to the ‘everything bubble’ of the past 18 months. Valuations across various asset classes, such as public equity, have experienced similar exponential growth the past 6 quarters. As for dry powder, this growth has been seen organically, meaning firms didn’t have to raise higher amounts of capital than normal, or use an outsized amount of the current supply to achieve this growth. Because of this, we see dry powder staying relatively steady, rather than an upcoming large growth or depletion.
Looking Ahead:
- Based on the previous financial crisis recovery, we should expect NAVs and dry powder to again align on a similar growth trajectory in the next 1-2 years. That being said, there are new circumstances and lingering factors (supply chain issues, inflation concerns) that may come to shape a different relationship between the two over the next decade.
- No matter the relationship between the two trendlines in the near future, it seems highly unlikely that we will see dry powder surpass NAVs any time soon, as they last did in Q2 2009.
Subscribe to our blog:

Is There Geographic Bias in Macro Liquidity Trends in Private Markets?
Is There Geographic Bias in Macro Liquidity Trends in Private Markets? Building on our previous analysis of the role of…

Private Equity Performance: Large Strategies Versus Funds of Funds, Co-Investments, and Secondaries
Private Equity Performance: Large Strategies Versus Funds of Funds, Co-Investments, and Secondaries In private equity, the large strategies of buyouts,…

Examining Tariff Policy Impacts on Private Fund Contribution Rates
Examining Tariff Policy Impacts on Private Fund Contribution Rates Recently we examined the impact of Latin America presidential elections—which carry presumptions…